U of I total enrollment is approximately 10,791 students. 6,323 are undergraduates and 1,567 are graduate students.
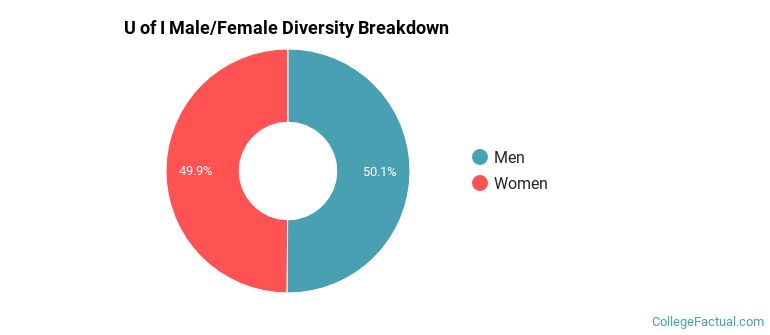
Male/Female Breakdown of Undergraduates
The full-time U of I undergraduate population is made up of 51% women, and 49% men.

For the gender breakdown for all students, go here.
U of I Racial/Ethnic Breakdown of Undergraduates

| Race/Ethnicity | Number |
|---|---|
| White | 4,823 |
| Hispanic | 721 |
| Multi-Ethnic | 250 |
| International | 162 |
| Asian | 111 |
| Unknown | 94 |
| Black or African American | 76 |
| Native Hawaiian or Pacific Islander | 25 |
See racial/ethnic breakdown for all students.
Male/Female Breakdown of Graduate Students
About 47% of full-time grad students are women, and 53% men.

For the gender breakdown for all students, go here.
U of I Racial-Ethnic Breakdown of Graduate Students

| Race/Ethnicity | Number |
|---|---|
| White | 1,047 |
| International | 219 |
| Hispanic | 95 |
| Multi-Ethnic | 73 |
| Unknown | 35 |
| Asian | 29 |
| Black or African American | 21 |
| Native Hawaiian or Pacific Islander | 18 |
See racial/ethnic breakdown for all students.

| Race/Ethnicity | Number |
|---|---|
| White | 8,027 |
| Hispanic | 1,035 |
| International | 475 |
| Multi-Ethnic | 421 |
| Unknown | 354 |
| Asian | 197 |
| Black or African American | 122 |
| Native Hawaiian or Pacific Islander | 47 |
There are approximately 5,484 female students and 5,307 male students at U of I.
U of I ranks 731 out of 2,183 when it comes to geographic diversity.
24.95% of U of I students come from out of state, and 2.41% come from out of the country.
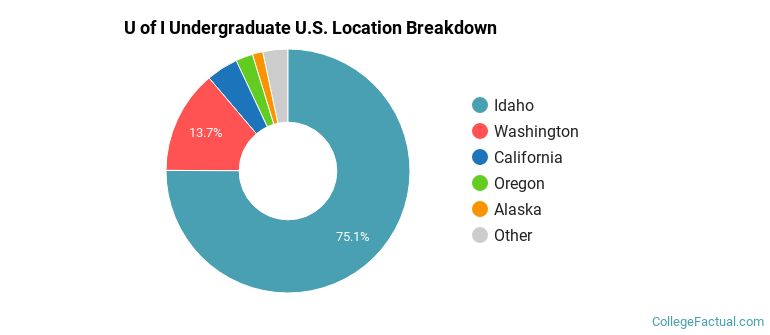
The undergraduate student body is split among 29 states (may include Washington D.C.). Click on the map for more detail.

| State | Amount |
|---|---|
| Idaho | 1,193 |
| Washington | 218 |
| California | 67 |
| Oregon | 36 |
| Alaska | 22 |
Students from 74 countries are represented at this school, with the majority of the international students coming from China, Saudi Arabia, and Nepal.
Learn more about international students at U of I.
A traditional college student is defined as being between the ages of 18-21. At U of I, 46.19% of students fall into that category, compared to the national average of 60%.

| Student Age Group | Amount |
|---|---|
| 18-19 | 2,792 |
| 20-21 | 2,784 |
| 22-24 | 1,900 |
| 25-29 | 1,201 |
| 35 and over | 938 |
| 30-34 | 558 |
| Under 18 | 0 |
Footnotes
*The racial-ethnic minorities count is calculated by taking the total number of students and subtracting white students, international students, and students whose race/ethnicity was unknown. This number is then divided by the total number of students at the school to obtain the racial-ethnic minorities percentage.
References
Department of Homeland Security Citizenship and Immigration Services
Image Credit: By Davidlharlan under License
Read College Factual's Diversity Ranking Methodology.