 by our College Data Analytics Team
Here is an overview of this program at UIC. You can study it at the Bachelor’s level. Its best result is a rank of #8 out of 14 schools (Bachelor’s level) by College Factual. Jump to any of the following sections:
By College Factual’s measure, UIC as a strong choice for drama & theater arts, coming in at #131 out of 359 schools nationally.
| Ranking | Rank |
|---|---|
| Best Drama & Theater Arts Schools | 131 of 359 |
| Best Drama & Theater Arts Schools in Illinois | 9 of 15 |
| Best Drama & Theater Arts Schools in the Great Lakes Region | 20 of 48 |
Here is each degree level offered in drama & theater arts at UIC, along with how many graduates complete each level annually.
| Degree Level | Annual Graduates |
|---|---|
| Bachelor’s | 30 |
For the most recent IPEDS reporting year, University of Illinois Chicago conferred 30 bachelor’s degrees in drama & theater arts.
UIC ranks competitively among schools offering drama & theater arts at the bachelor’s level. In particular it placed #8 out of 14 schools by College Factual.
Drama & Theater Arts students who finish a bachelor’s at UIC go on to jobs where they make a median salary of $21,798 a year. This is below $73,881, the median for all majors at UIC.
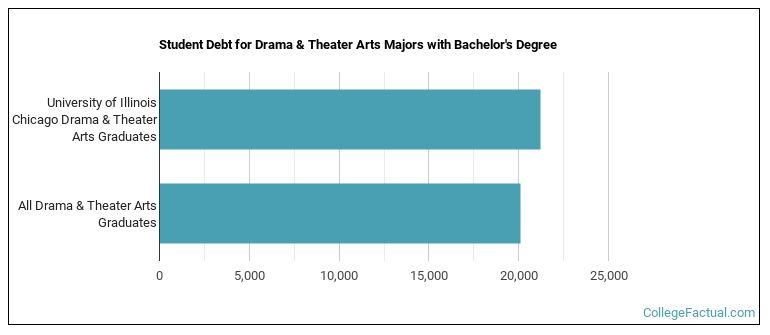
To complete a bachelor’s at UIC, drama & theater arts students borrow a median amount of $21,238 in student loans. This is higher than $20,119, the typical median for all majors at UIC.
The full-time undergraduate tuition and fees are shown below.
| In State | Out of State | |
|---|---|---|
| Tuition | $10,776 | $28,849 |
| Fees | $3,160 | $3,160 |
Learn more about UIC tuition and fees.
In the most recent graduating class, 40% of drama & theater arts bachelor’s degrees went to men and 60% went to women.
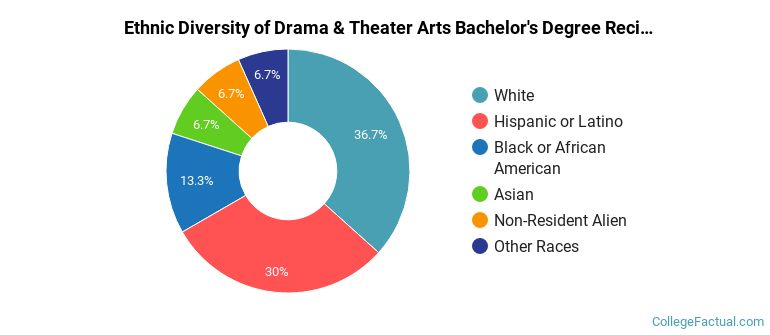
 The majority of drama & theater arts bachelor’s degree graduates at UIC are White. About 37% of graduates fell into this category.
The following table and chart show the ethnic background for students who recently graduated from University of Illinois Chicago with a bachelor’s in drama & theater arts.
| Ethnic Background | Number of Students |
|---|---|
| Asian | 2 |
| Black or African American | 4 |
| Hispanic or Latino | 9 |
| White | 11 |
| Non-Resident Aliens | 2 |
| Other Races | 2 |
UIC conferred 14 bachelor’s completions in drama and dramatics/theatre arts, general in the latest year of data — 50% to women and 50% to men. The largest share of these graduates were Hispanic or Latino (43%).
UIC conferred 11 bachelor’s degrees in acting recently — 55% to women and 45% to men. The most common background among these graduates was White (45%).
UIC awarded 5 bachelor’s completions in technical theatre/theatre design and technology in the most recent reporting year — 100% to women and 0% to men. The largest share of these graduates were White (60%).
