UIUC total enrollment is approximately 52,679 students. 32,107 are undergraduates and 11,167 are graduate students.
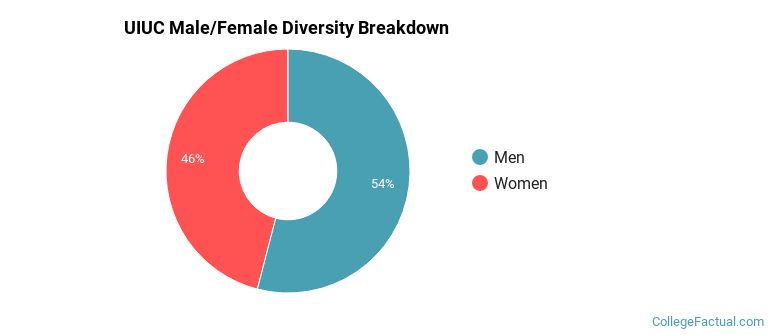
Male/Female Breakdown of Undergraduates
The full-time UIUC undergraduate population is made up of 47% women, and 53% men.
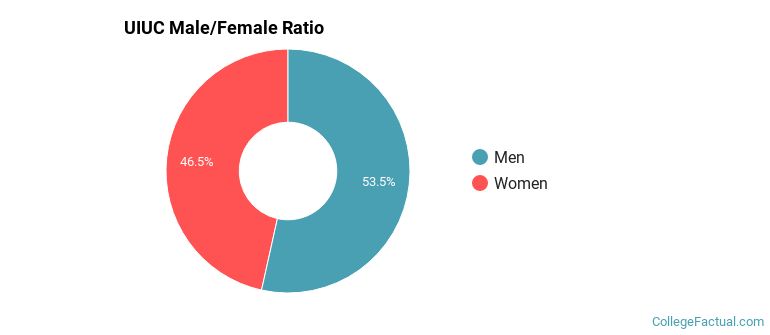
For the gender breakdown for all students, go here.
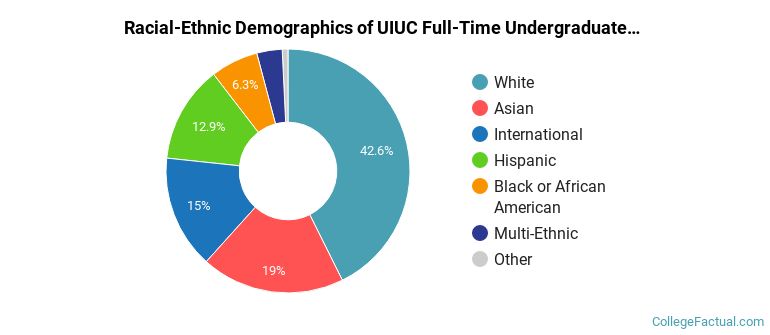
UIUC Racial/Ethnic Breakdown of Undergraduates
| Race/Ethnicity | Number |
|---|---|
| White | 13,475 |
| Asian | 6,397 |
| Hispanic | 4,525 |
| International | 4,175 |
| Black or African American | 2,085 |
| Multi-Ethnic | 1,129 |
| Unknown | 300 |
| Native Hawaiian or Pacific Islander | 12 |
See racial/ethnic breakdown for all students.
Male/Female Breakdown of Graduate Students
About 46% of full-time grad students are women, and 54% men.

For the gender breakdown for all students, go here.
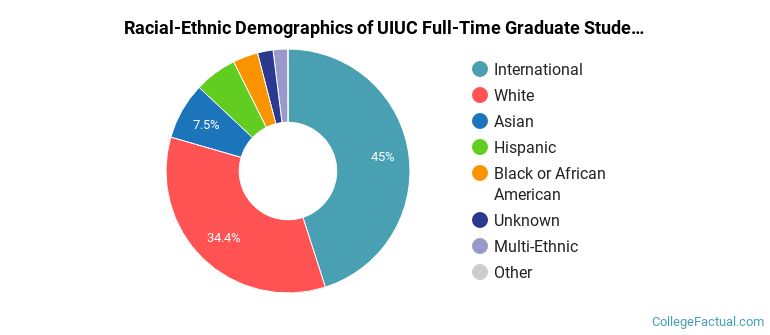
UIUC Racial-Ethnic Breakdown of Graduate Students
| Race/Ethnicity | Number |
|---|---|
| International | 4,285 |
| White | 4,154 |
| Asian | 1,010 |
| Hispanic | 726 |
| Black or African American | 454 |
| Unknown | 290 |
| Multi-Ethnic | 236 |
| Native Hawaiian or Pacific Islander | 4 |
See racial/ethnic breakdown for all students.
| Race/Ethnicity | Number |
|---|---|
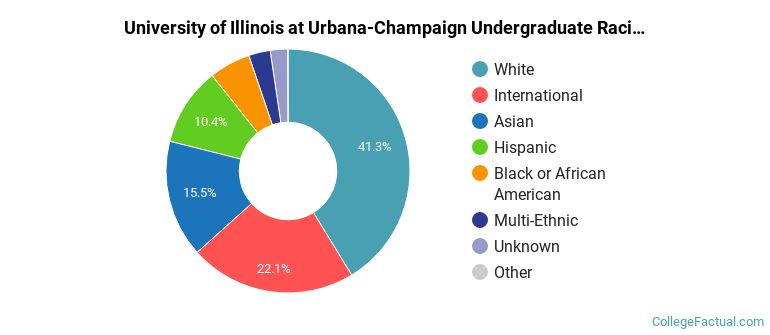
| White | 21,746 |
| International | 10,140 |
| Asian | 8,685 |
| Hispanic | 5,947 |
| Black or African American | 3,015 |
| Multi-Ethnic | 1,575 |
| Unknown | 1,528 |
| Native Hawaiian or Pacific Islander | 25 |
There are approximately 23,994 female students and 28,685 male students at UIUC.
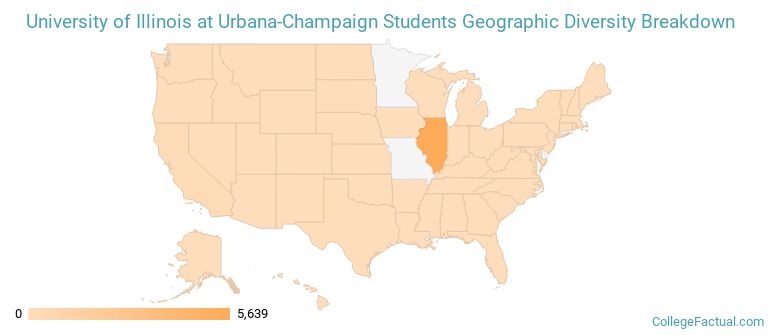
UIUC ranks 620 out of 2,183 when it comes to geographic diversity.
12.83% of UIUC students come from out of state, and 13.72% come from out of the country.
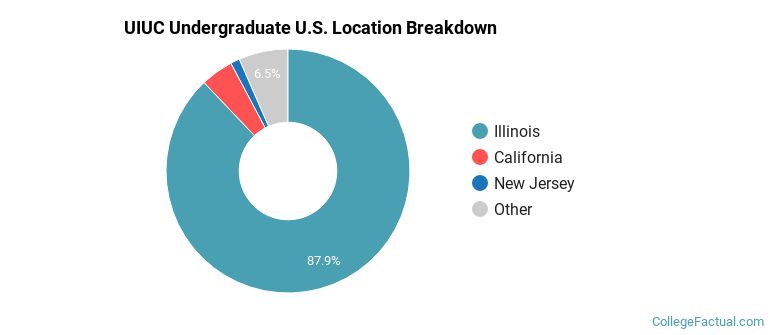
The undergraduate student body is split among 37 states (may include Washington D.C.). Click on the map for more detail.
| State | Amount |
|---|---|
| Illinois | 5,639 |
| California | 278 |
| New Jersey | 78 |
| Texas | 39 |
| New York | 33 |
Students from 116 countries are represented at this school, with the majority of the international students coming from China, India, and South Korea.
Learn more about international students at UIUC.
A traditional college student is defined as being between the ages of 18-21. At UIUC, 61.91% of students fall into that category, compared to the national average of 60%.
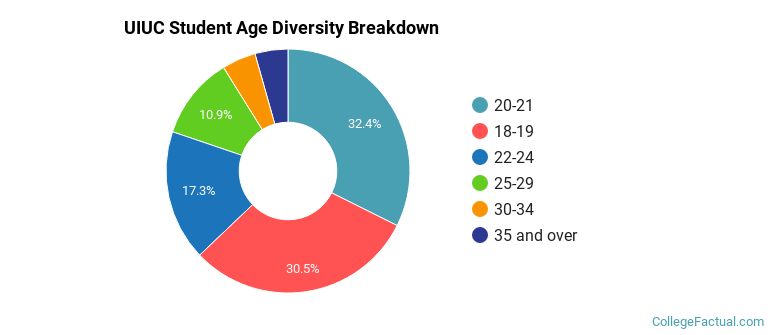
| Student Age Group | Amount |
|---|---|
| 20-21 | 15,369 |
| 18-19 | 14,482 |
| 22-24 | 8,226 |
| 25-29 | 5,181 |
| 30-34 | 2,135 |
| 35 and over | 2,077 |
| Under 18 | 0 |
Footnotes
*The racial-ethnic minorities count is calculated by taking the total number of students and subtracting white students, international students, and students whose race/ethnicity was unknown. This number is then divided by the total number of students at the school to obtain the racial-ethnic minorities percentage.
References
Department of Homeland Security Citizenship and Immigration Services
Image Credit: By Beyond My ken under License