UIndy total enrollment is approximately 5,638 students. 3,863 are undergraduates and 720 are graduate students.
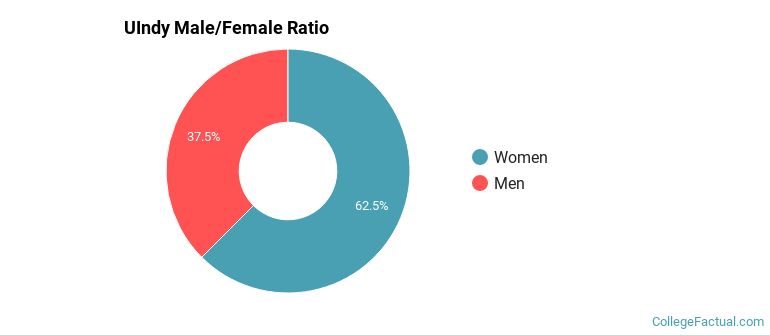
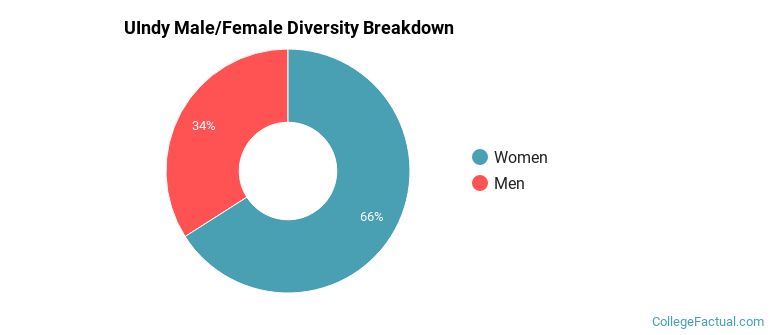
Male/Female Breakdown of Undergraduates
The full-time UIndy undergraduate population is made up of 63% women, and 37% men.
For the gender breakdown for all students, go here.
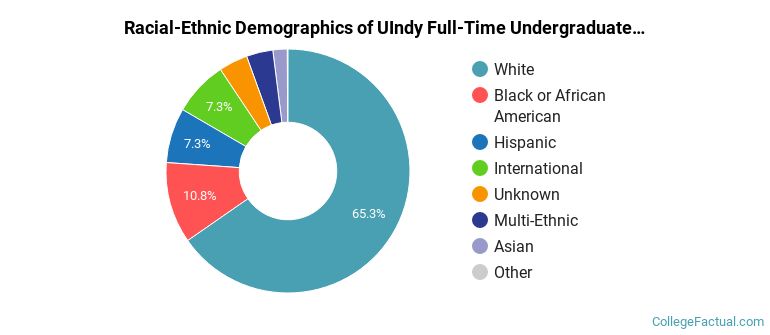
UIndy Racial/Ethnic Breakdown of Undergraduates
| Race/Ethnicity | Number |
|---|---|
| White | 2,443 |
| Black or African American | 472 |
| Hispanic | 312 |
| International | 255 |
| Multi-Ethnic | 144 |
| Unknown | 130 |
| Asian | 101 |
| Native Hawaiian or Pacific Islander | 5 |
See racial/ethnic breakdown for all students.
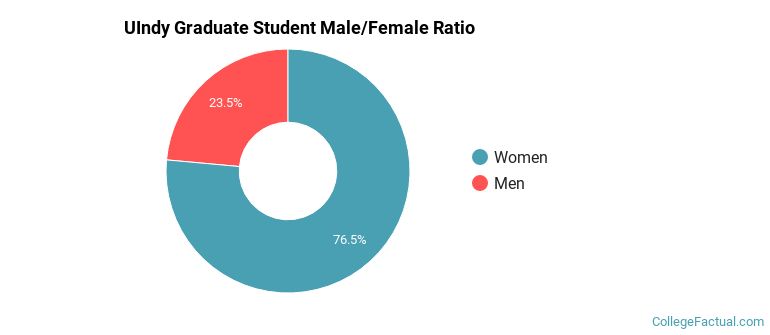
Male/Female Breakdown of Graduate Students
About 75% of full-time grad students are women, and 25% men.
For the gender breakdown for all students, go here.
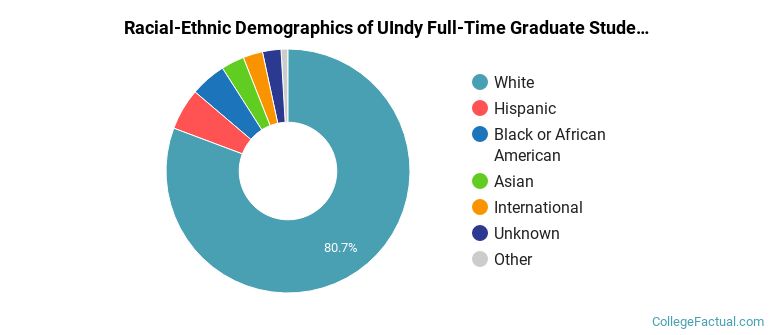
UIndy Racial-Ethnic Breakdown of Graduate Students
| Race/Ethnicity | Number |
|---|---|
| White | 567 |
| Hispanic | 46 |
| Black or African American | 38 |
| International | 25 |
| Asian | 22 |
| Multi-Ethnic | 13 |
| Unknown | 9 |
| Native Hawaiian or Pacific Islander | 0 |
See racial/ethnic breakdown for all students.

| Race/Ethnicity | Number |
|---|---|
| White | 3,751 |
| Black or African American | 633 |
| Hispanic | 417 |
| International | 313 |
| Unknown | 189 |
| Multi-Ethnic | 177 |
| Asian | 146 |
| Native Hawaiian or Pacific Islander | 8 |
There are approximately 3,715 female students and 1,923 male students at UIndy.
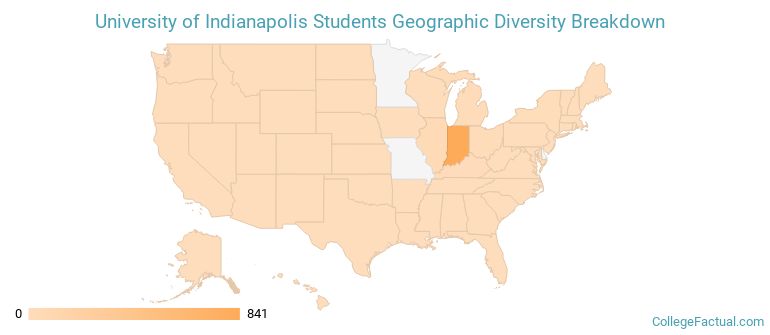
UIndy ranks 1,083 out of 2,183 when it comes to geographic diversity.
14.62% of UIndy students come from out of state, and 0% come from out of the country.
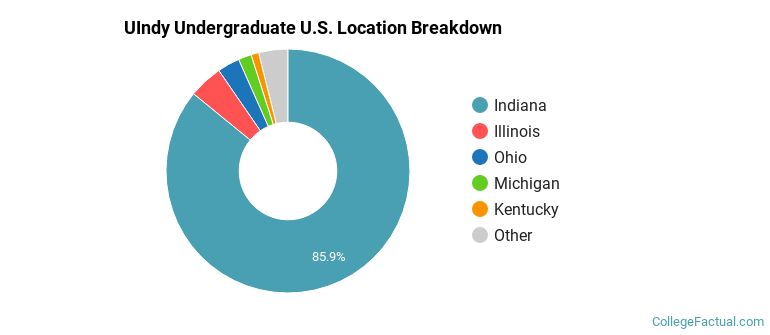
The undergraduate student body is split among 26 states (may include Washington D.C.). Click on the map for more detail.
| State | Amount |
|---|---|
| Indiana | 841 |
| Illinois | 44 |
| Ohio | 29 |
| Michigan | 17 |
| Kentucky | 10 |
Students from 63 countries are represented at this school, with the majority of the international students coming from Saudi Arabia, India, and China.
Learn more about international students at UIndy.
A traditional college student is defined as being between the ages of 18-21. At UIndy, 54.52% of students fall into that category, compared to the national average of 60%.
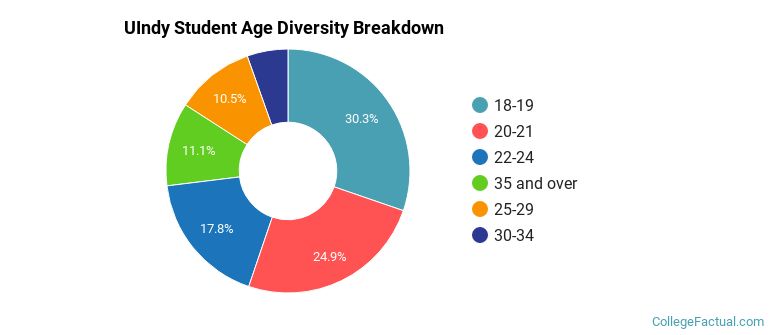
| Student Age Group | Amount |
|---|---|
| 18-19 | 1,785 |
| 20-21 | 1,471 |
| 22-24 | 1,052 |
| 35 and over | 652 |
| 25-29 | 617 |
| 30-34 | 320 |
| Under 18 | 0 |
Footnotes
*The racial-ethnic minorities count is calculated by taking the total number of students and subtracting white students, international students, and students whose race/ethnicity was unknown. This number is then divided by the total number of students at the school to obtain the racial-ethnic minorities percentage.
References
Department of Homeland Security Citizenship and Immigration Services
Image Credit: By Christopher Ziemnowicz under License
Find out how College Factual created their Diversity Rankings.