KU total enrollment is approximately 26,744 students. 16,439 are undergraduates and 5,377 are graduate students.
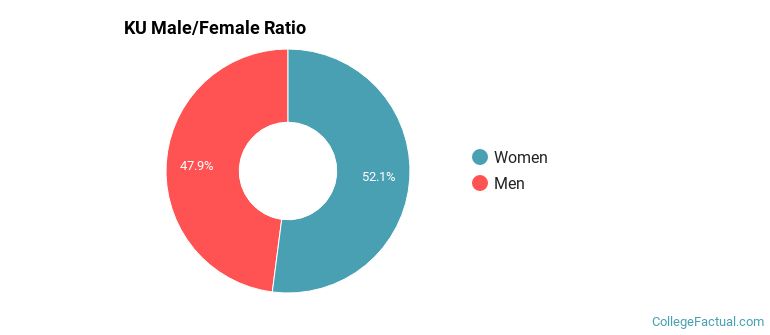
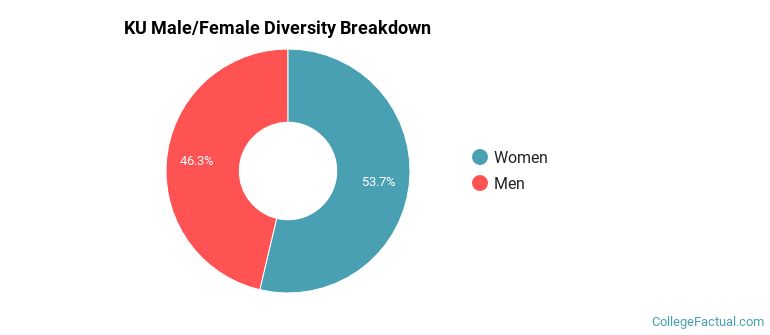
Male/Female Breakdown of Undergraduates
The full-time KU undergraduate population is made up of 53% women, and 47% men.
For the gender breakdown for all students, go here.
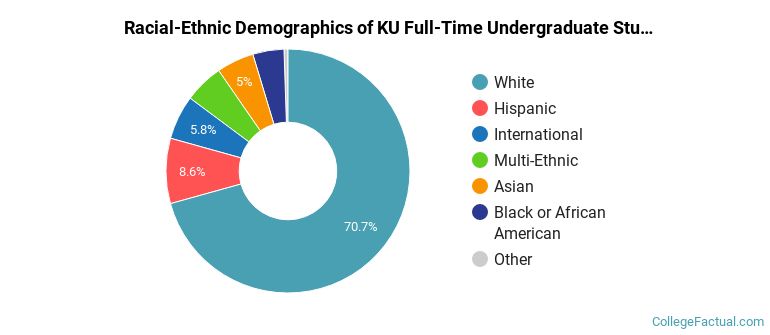
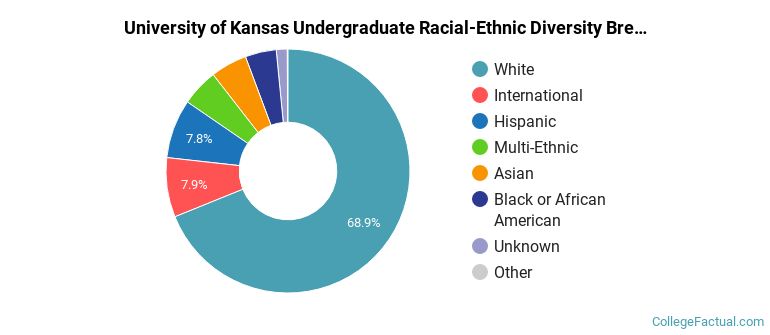
KU Racial/Ethnic Breakdown of Undergraduates
| Race/Ethnicity | Number |
|---|---|
| White | 11,578 |
| Hispanic | 1,444 |
| Multi-Ethnic | 908 |
| Asian | 898 |
| International | 803 |
| Black or African American | 660 |
| Unknown | 60 |
| Native Hawaiian or Pacific Islander | 20 |
See racial/ethnic breakdown for all students.
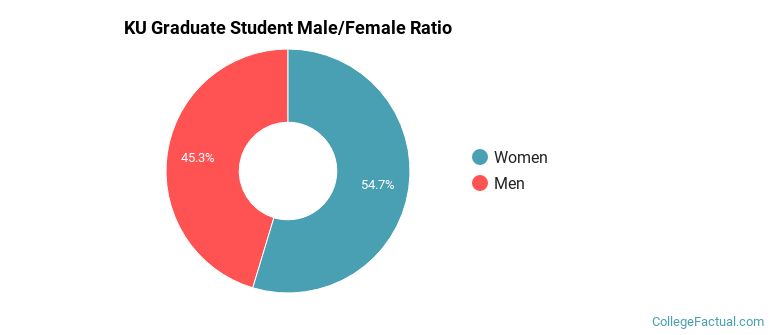
Male/Female Breakdown of Graduate Students
About 55% of full-time grad students are women, and 45% men.
For the gender breakdown for all students, go here.
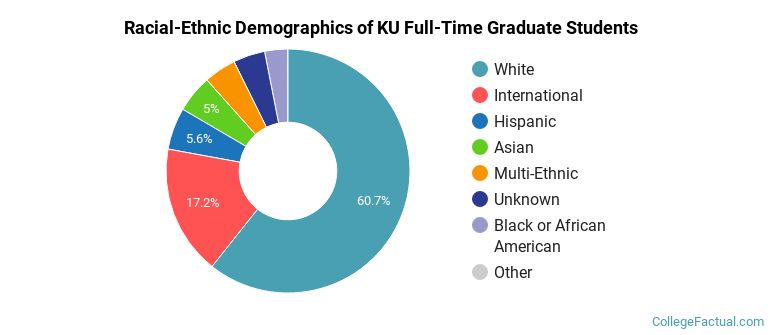
KU Racial-Ethnic Breakdown of Graduate Students
| Race/Ethnicity | Number |
|---|---|
| White | 3,353 |
| International | 791 |
| Hispanic | 363 |
| Asian | 301 |
| Multi-Ethnic | 237 |
| Black or African American | 187 |
| Unknown | 102 |
| Native Hawaiian or Pacific Islander | 5 |
See racial/ethnic breakdown for all students.
| Race/Ethnicity | Number |
|---|---|
| White | 18,356 |
| Hispanic | 2,231 |
| International | 1,774 |
| Asian | 1,436 |
| Multi-Ethnic | 1,384 |
| Black or African American | 1,140 |
| Unknown | 253 |
| Native Hawaiian or Pacific Islander | 30 |
There are approximately 14,419 female students and 12,325 male students at KU.
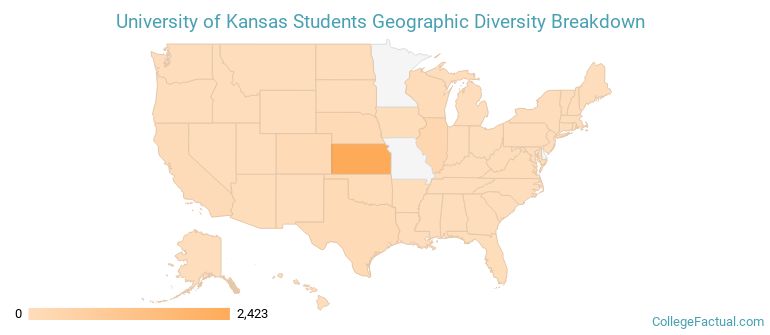
KU ranks 280 out of 2,183 when it comes to geographic diversity.
39.78% of KU students come from out of state, and 4.63% come from out of the country.
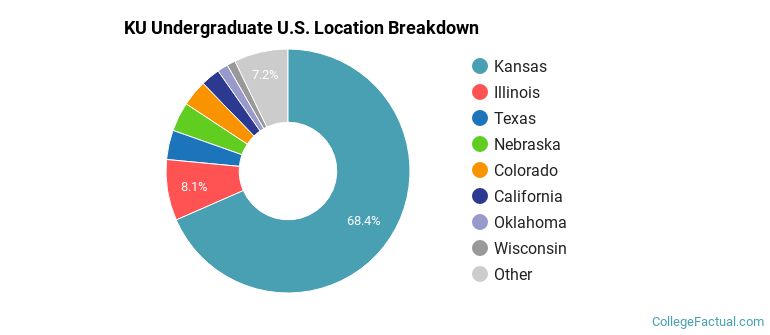
The undergraduate student body is split among 46 states (may include Washington D.C.). Click on the map for more detail.
| State | Amount |
|---|---|
| Kansas | 2,423 |
| Illinois | 286 |
| Texas | 138 |
| Nebraska | 137 |
| Colorado | 123 |
Students from 106 countries are represented at this school, with the majority of the international students coming from China, India, and Saudi Arabia.
Learn more about international students at KU.
A traditional college student is defined as being between the ages of 18-21. At KU, 52.45% of students fall into that category, compared to the national average of 60%.
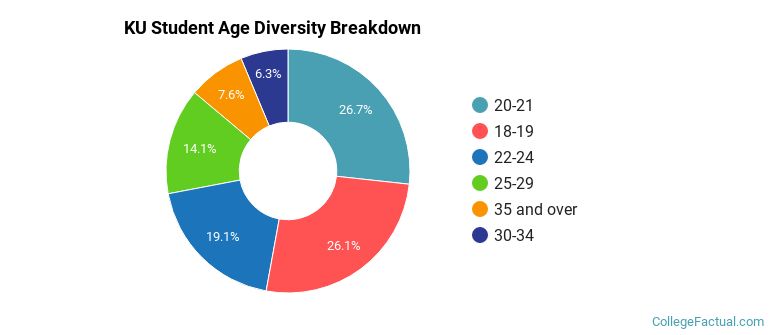
| Student Age Group | Amount |
|---|---|
| 20-21 | 7,326 |
| 18-19 | 7,164 |
| 22-24 | 5,246 |
| 25-29 | 3,864 |
| 35 and over | 2,085 |
| 30-34 | 1,723 |
| Under 18 | 0 |
Footnotes
*The racial-ethnic minorities count is calculated by taking the total number of students and subtracting white students, international students, and students whose race/ethnicity was unknown. This number is then divided by the total number of students at the school to obtain the racial-ethnic minorities percentage.
References
Department of Homeland Security Citizenship and Immigration Services
Read College Factual's Diversity Ranking Methodology.