UK total enrollment is approximately 29,986 students. 20,239 are undergraduates and 6,005 are graduate students.
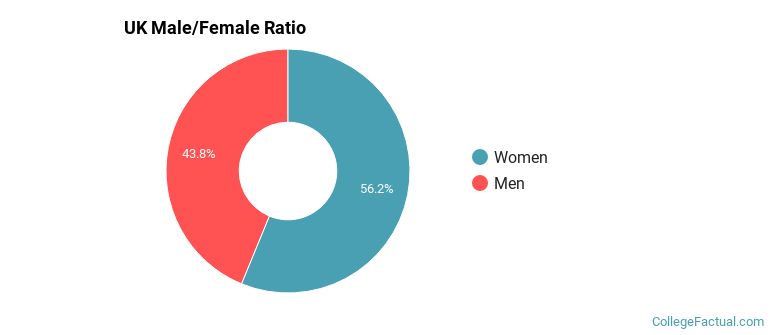
Male/Female Breakdown of Undergraduates
The full-time UK undergraduate population is made up of 57% women, and 43% men.
For the gender breakdown for all students, go here.
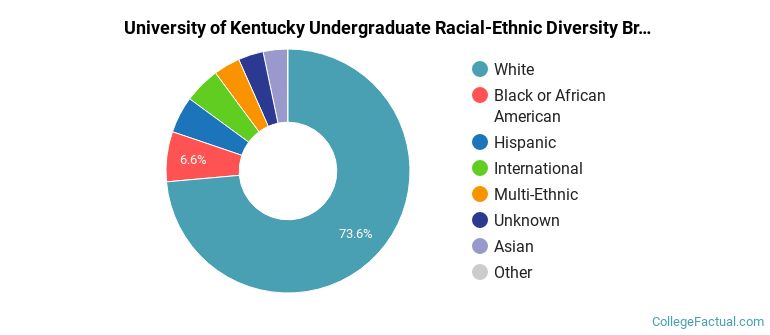
UK Racial/Ethnic Breakdown of Undergraduates
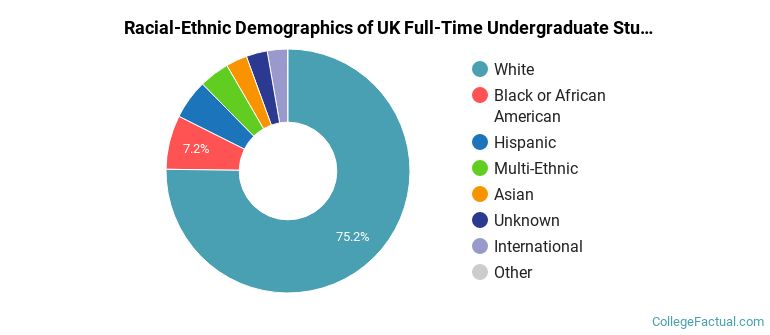
| Race/Ethnicity | Number |
|---|---|
| White | 15,157 |
| Black or African American | 1,404 |
| Hispanic | 1,138 |
| Multi-Ethnic | 800 |
| Asian | 630 |
| Unknown | 557 |
| International | 504 |
| Native Hawaiian or Pacific Islander | 11 |
See racial/ethnic breakdown for all students.
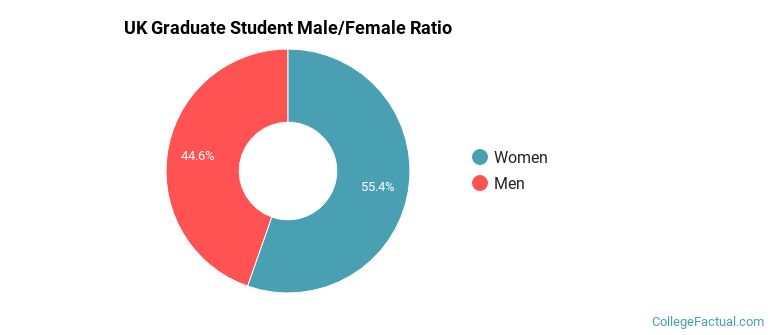
Male/Female Breakdown of Graduate Students
About 57% of full-time grad students are women, and 43% men.
For the gender breakdown for all students, go here.
UK Racial-Ethnic Breakdown of Graduate Students
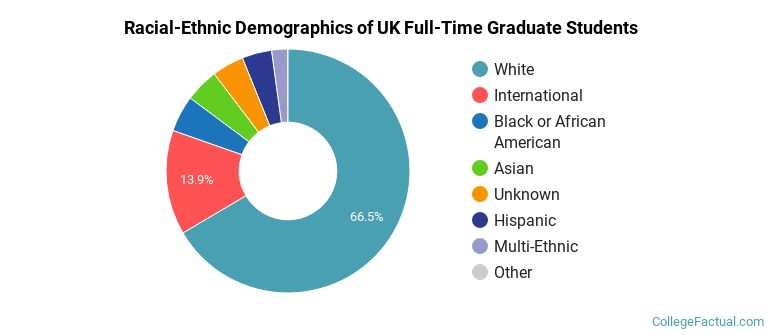
| Race/Ethnicity | Number |
|---|---|
| White | 4,054 |
| International | 704 |
| Black or African American | 367 |
| Hispanic | 254 |
| Asian | 252 |
| Unknown | 244 |
| Multi-Ethnic | 121 |
| Native Hawaiian or Pacific Islander | 1 |
See racial/ethnic breakdown for all students.
| Race/Ethnicity | Number |
|---|---|
| White | 21,992 |
| Black or African American | 2,068 |
| Hispanic | 1,558 |
| International | 1,231 |
| Multi-Ethnic | 1,036 |
| Unknown | 1,034 |
| Asian | 1,000 |
| Native Hawaiian or Pacific Islander | 15 |

There are approximately 17,250 female students and 12,736 male students at UK.
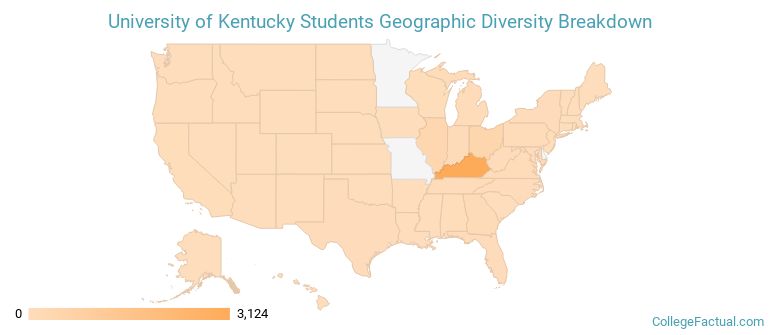
UK ranks 378 out of 2,183 when it comes to geographic diversity.
37.99% of UK students come from out of state, and 1.43% come from out of the country.
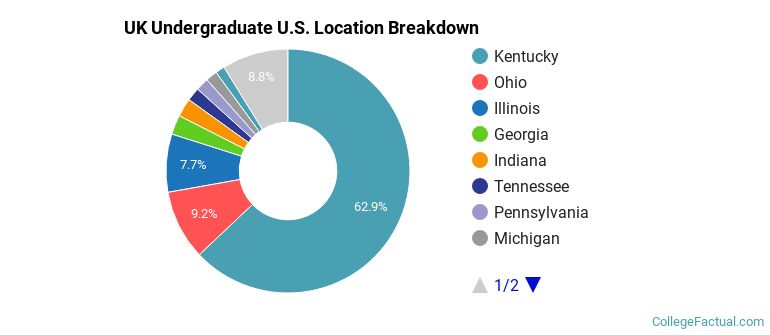
The undergraduate student body is split among 43 states (may include Washington D.C.). Click on the map for more detail.
| State | Amount |
|---|---|
| Kentucky | 3,124 |
| Ohio | 459 |
| Illinois | 382 |
| Georgia | 128 |
| Indiana | 122 |
Students from 105 countries are represented at this school, with the majority of the international students coming from China, India, and South Korea.
Learn more about international students at UK.
A traditional college student is defined as being between the ages of 18-21. At UK, 59.45% of students fall into that category, compared to the national average of 60%.
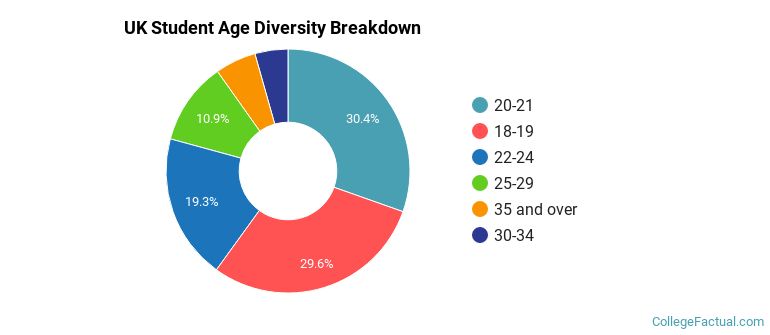
| Student Age Group | Amount |
|---|---|
| 20-21 | 8,881 |
| 18-19 | 8,635 |
| 22-24 | 5,626 |
| 25-29 | 3,195 |
| 35 and over | 1,586 |
| 30-34 | 1,281 |
| Under 18 | 0 |
Footnotes
*The racial-ethnic minorities count is calculated by taking the total number of students and subtracting white students, international students, and students whose race/ethnicity was unknown. This number is then divided by the total number of students at the school to obtain the racial-ethnic minorities percentage.
References
Department of Homeland Security Citizenship and Immigration Services
Read College Factual's Diversity Ranking Methodology.