ULV total enrollment is approximately 6,983 students. 3,244 are undergraduates and 1,558 are graduate students.
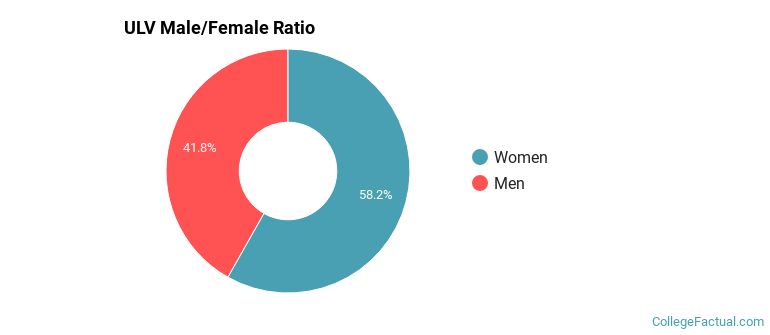
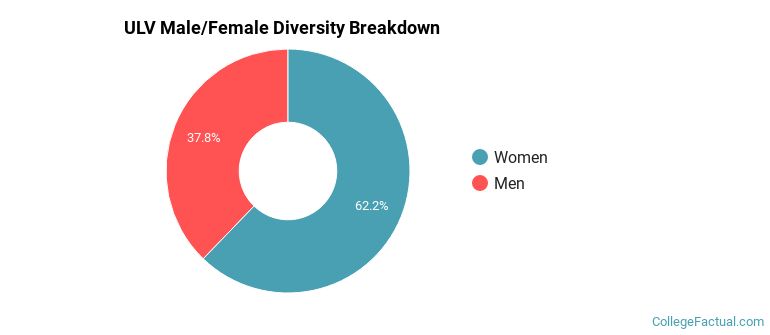
Male/Female Breakdown of Undergraduates
The full-time ULV undergraduate population is made up of 59% women, and 41% men.
For the gender breakdown for all students, go here.
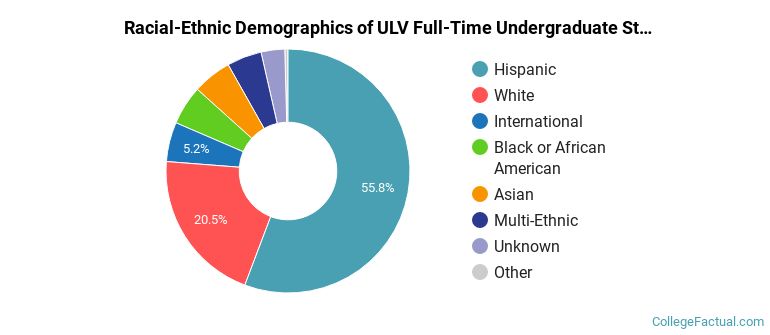
ULV Racial/Ethnic Breakdown of Undergraduates
| Race/Ethnicity | Number |
|---|---|
| Hispanic | 1,907 |
| White | 577 |
| Black or African American | 203 |
| Asian | 169 |
| Multi-Ethnic | 135 |
| International | 132 |
| Unknown | 92 |
| Native Hawaiian or Pacific Islander | 16 |
See racial/ethnic breakdown for all students.
Male/Female Breakdown of Graduate Students
About 66% of full-time grad students are women, and 34% men.

For the gender breakdown for all students, go here.
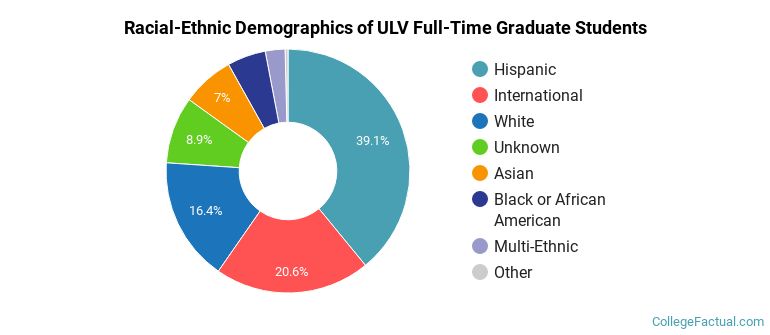
ULV Racial-Ethnic Breakdown of Graduate Students
| Race/Ethnicity | Number |
|---|---|
| Hispanic | 706 |
| White | 293 |
| International | 216 |
| Asian | 106 |
| Unknown | 98 |
| Black or African American | 83 |
| Multi-Ethnic | 45 |
| Native Hawaiian or Pacific Islander | 7 |
See racial/ethnic breakdown for all students.
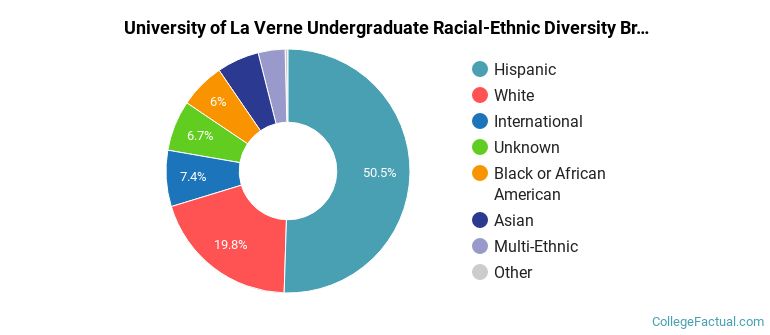
| Race/Ethnicity | Number |
|---|---|
| Hispanic | 3,758 |
| White | 1,346 |
| Black or African American | 456 |
| Asian | 402 |
| International | 384 |
| Unknown | 332 |
| Multi-Ethnic | 245 |
| Native Hawaiian or Pacific Islander | 34 |
There are approximately 4,423 female students and 2,560 male students at ULV.
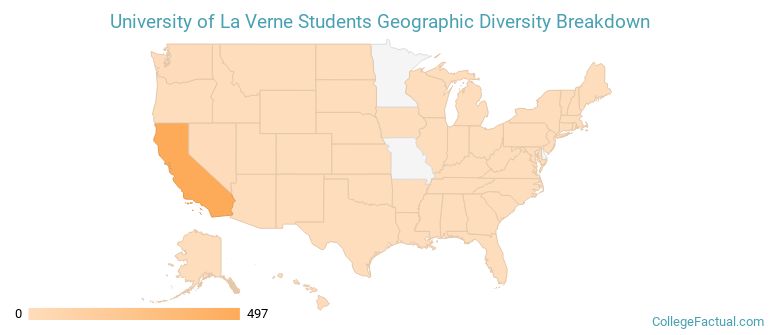
ULV ranks 1,585 out of 2,183 when it comes to geographic diversity.
4.42% of ULV students come from out of state, and 6.28% come from out of the country.
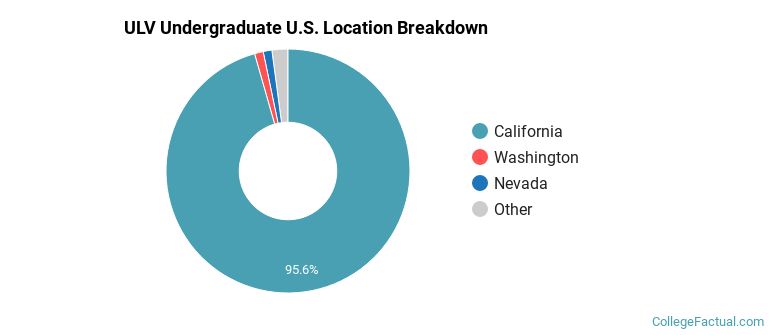
The undergraduate student body is split among 9 states (may include Washington D.C.). Click on the map for more detail.
| State | Amount |
|---|---|
| California | 497 |
| Nevada | 6 |
| Washington | 6 |
| Hawaii | 5 |
| Arizona | 2 |
Students from 50 countries are represented at this school, with the majority of the international students coming from China, Taiwan, and Qatar.
Learn more about international students at ULV.
A traditional college student is defined as being between the ages of 18-21. At ULV, 27.49% of students fall into that category, compared to the national average of 60%.
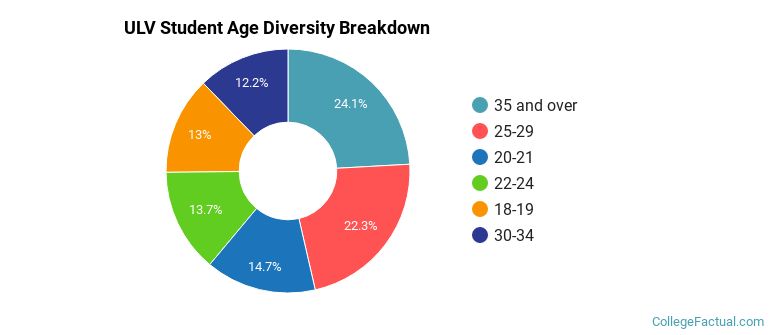
| Student Age Group | Amount |
|---|---|
| 35 and over | 1,957 |
| 25-29 | 1,809 |
| 20-21 | 1,191 |
| 22-24 | 1,115 |
| 18-19 | 1,052 |
| 30-34 | 991 |
| Under 18 | 0 |
Footnotes
*The racial-ethnic minorities count is calculated by taking the total number of students and subtracting white students, international students, and students whose race/ethnicity was unknown. This number is then divided by the total number of students at the school to obtain the racial-ethnic minorities percentage.
References
Department of Homeland Security Citizenship and Immigration Services
Learn more about how College Factual creates their Diversity Rankings.