UL Lafayette total enrollment is approximately 16,450 students. 11,318 are undergraduates and 1,123 are graduate students.
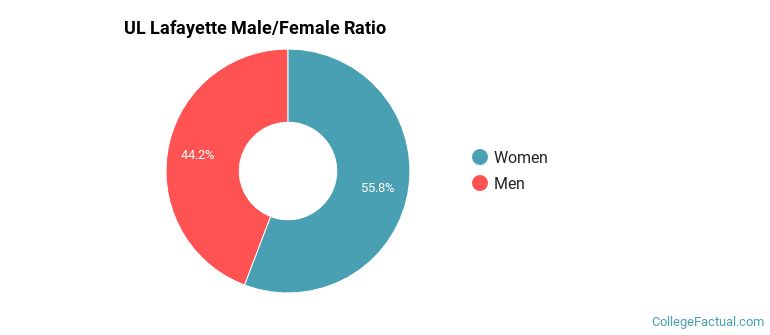
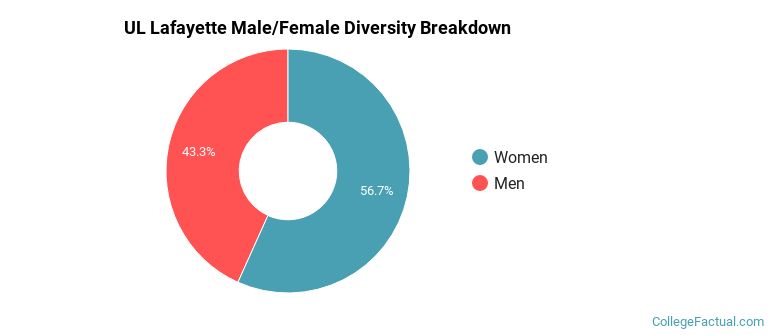
Male/Female Breakdown of Undergraduates
The full-time UL Lafayette undergraduate population is made up of 57% women, and 43% men.
For the gender breakdown for all students, go here.
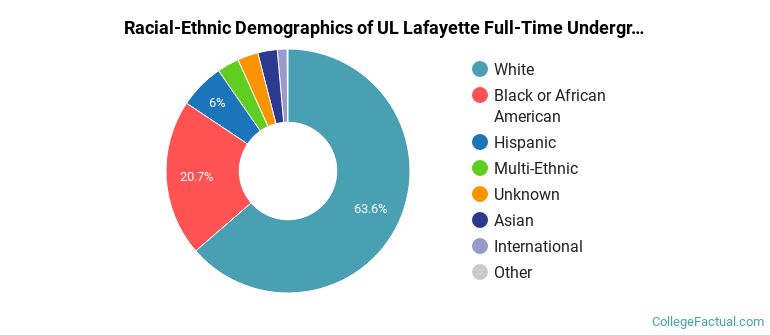
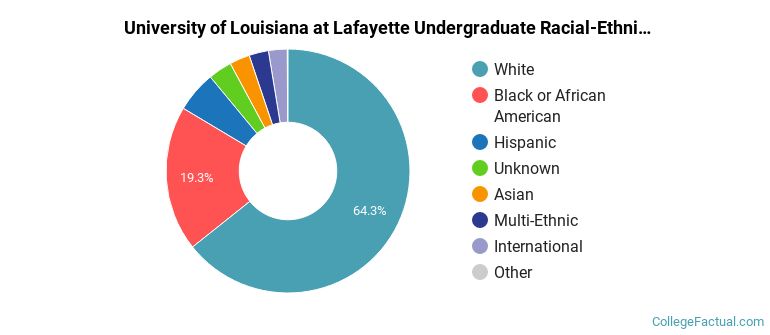
UL Lafayette Racial/Ethnic Breakdown of Undergraduates
| Race/Ethnicity | Number |
|---|---|
| White | 7,022 |
| Black or African American | 2,413 |
| Hispanic | 715 |
| Multi-Ethnic | 411 |
| Unknown | 299 |
| Asian | 285 |
| International | 126 |
| Native Hawaiian or Pacific Islander | 10 |
See racial/ethnic breakdown for all students.
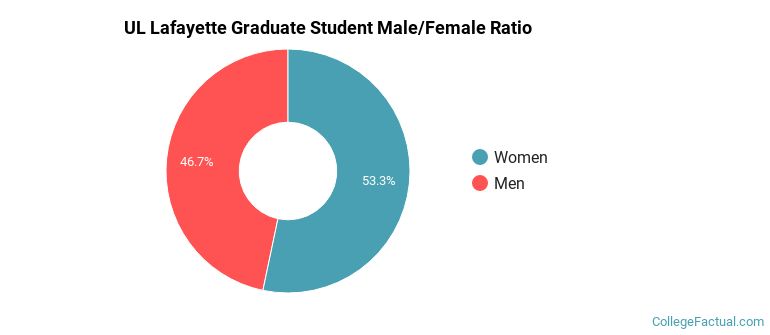
Male/Female Breakdown of Graduate Students
About 56% of full-time grad students are women, and 44% men.
For the gender breakdown for all students, go here.
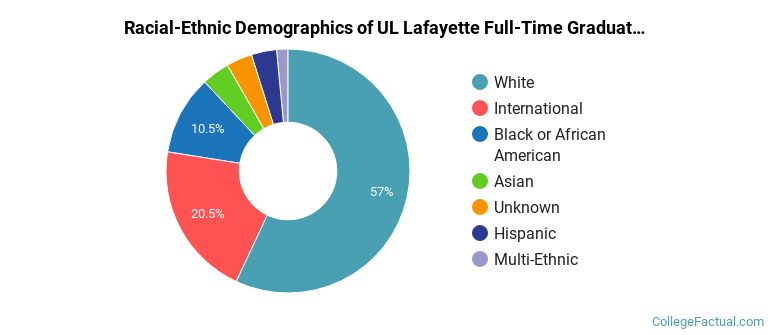
UL Lafayette Racial-Ethnic Breakdown of Graduate Students
| Race/Ethnicity | Number |
|---|---|
| White | 634 |
| International | 201 |
| Black or African American | 139 |
| Asian | 46 |
| Hispanic | 45 |
| Unknown | 35 |
| Multi-Ethnic | 21 |
| Native Hawaiian or Pacific Islander | 0 |
See racial/ethnic breakdown for all students.
| Race/Ethnicity | Number |
|---|---|
| White | 10,281 |
| Black or African American | 3,314 |
| Hispanic | 948 |
| Multi-Ethnic | 522 |
| Unknown | 491 |
| Asian | 451 |
| International | 379 |
| Native Hawaiian or Pacific Islander | 13 |
There are approximately 9,451 female students and 6,999 male students at UL Lafayette.
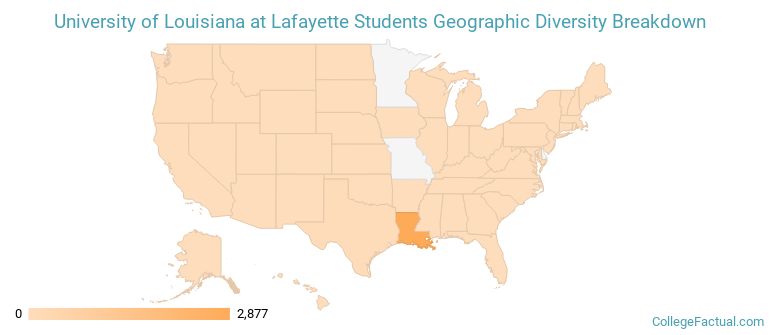
UL Lafayette ranks 1,451 out of 2,183 when it comes to geographic diversity.
4.26% of UL Lafayette students come from out of state, and 0.63% come from out of the country.
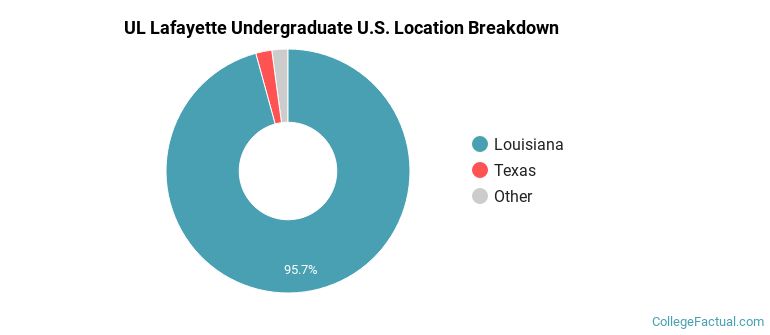
The undergraduate student body is split among 23 states (may include Washington D.C.). Click on the map for more detail.
| State | Amount |
|---|---|
| Louisiana | 2,877 |
| Texas | 64 |
| Florida | 9 |
| California | 7 |
| Mississippi | 6 |
Students from 82 countries are represented at this school, with the majority of the international students coming from India, China, and Oman.
Learn more about international students at UL Lafayette.
A traditional college student is defined as being between the ages of 18-21. At UL Lafayette, 56.87% of students fall into that category, compared to the national average of 60%.
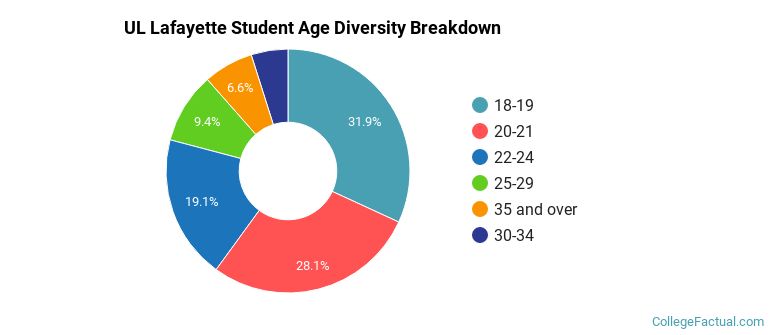
| Student Age Group | Amount |
|---|---|
| 18-19 | 5,224 |
| 20-21 | 4,613 |
| 22-24 | 3,129 |
| 25-29 | 1,538 |
| 35 and over | 1,085 |
| 30-34 | 800 |
| Under 18 | 0 |
Footnotes
*The racial-ethnic minorities count is calculated by taking the total number of students and subtracting white students, international students, and students whose race/ethnicity was unknown. This number is then divided by the total number of students at the school to obtain the racial-ethnic minorities percentage.
References
Department of Homeland Security Citizenship and Immigration Services
Image Credit: By Billy Hathorn under License
Read College Factual's Diversity Ranking Methodology.