ULM total enrollment is approximately 8,888 students. 4,568 are undergraduates and 1,037 are graduate students.
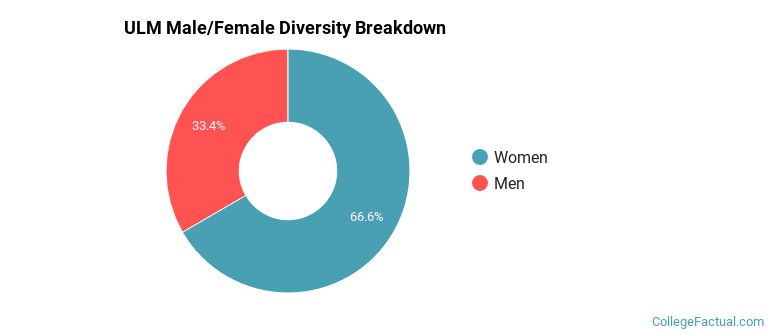
Male/Female Breakdown of Undergraduates
The full-time ULM undergraduate population is made up of 64% women, and 36% men.

For the gender breakdown for all students, go here.
ULM Racial/Ethnic Breakdown of Undergraduates
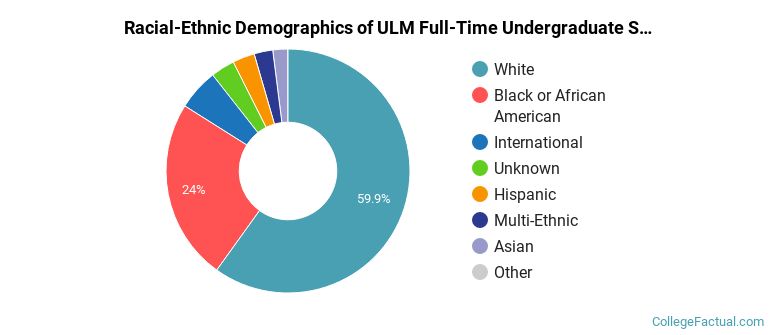
| Race/Ethnicity | Number |
|---|---|
| White | 2,776 |
| Black or African American | 1,084 |
| International | 201 |
| Unknown | 153 |
| Hispanic | 136 |
| Multi-Ethnic | 120 |
| Asian | 83 |
| Native Hawaiian or Pacific Islander | 1 |
See racial/ethnic breakdown for all students.
Male/Female Breakdown of Graduate Students
About 73% of full-time grad students are women, and 27% men.

For the gender breakdown for all students, go here.
ULM Racial-Ethnic Breakdown of Graduate Students

| Race/Ethnicity | Number |
|---|---|
| White | 654 |
| Black or African American | 195 |
| International | 58 |
| Multi-Ethnic | 34 |
| Unknown | 34 |
| Asian | 32 |
| Hispanic | 23 |
| Native Hawaiian or Pacific Islander | 0 |
See racial/ethnic breakdown for all students.

| Race/Ethnicity | Number |
|---|---|
| White | 5,548 |
| Black or African American | 2,015 |
| Unknown | 348 |
| International | 283 |
| Hispanic | 258 |
| Multi-Ethnic | 231 |
| Asian | 163 |
| Native Hawaiian or Pacific Islander | 5 |
There are approximately 6,015 female students and 2,873 male students at ULM.
ULM ranks 1,413 out of 2,183 when it comes to geographic diversity.
7.01% of ULM students come from out of state, and 4.01% come from out of the country.
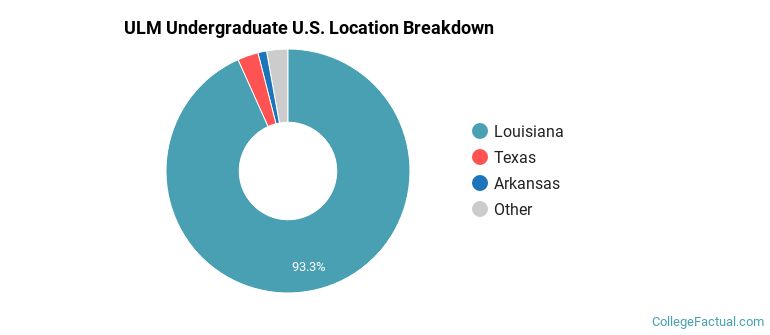
The undergraduate student body is split among 18 states (may include Washington D.C.). Click on the map for more detail.

| State | Amount |
|---|---|
| Louisiana | 1,221 |
| Texas | 36 |
| Arkansas | 15 |
| Mississippi | 11 |
| Kansas | 5 |
Students from 57 countries are represented at this school, with the majority of the international students coming from Nepal, India, and Nigeria.
Learn more about international students at ULM.
A traditional college student is defined as being between the ages of 18-21. At ULM, 48.77% of students fall into that category, compared to the national average of 60%.

| Student Age Group | Amount |
|---|---|
| 18-19 | 2,421 |
| 20-21 | 2,057 |
| 22-24 | 1,412 |
| 25-29 | 677 |
| 35 and over | 510 |
| 30-34 | 343 |
| Under 18 | 0 |
Footnotes
*The racial-ethnic minorities count is calculated by taking the total number of students and subtracting white students, international students, and students whose race/ethnicity was unknown. This number is then divided by the total number of students at the school to obtain the racial-ethnic minorities percentage.
References
Department of Homeland Security Citizenship and Immigration Services
Image Credit: By Billy Hathorn under License
Read College Factual's Diversity Ranking Methodology.