Here is an overview of this program at University of Louisville. You can study it at the Bachelor’s level, with graduate study also available. It ranks as high as #1 out of 18 schools (Bachelor’s level) by College Factual. Jump to any of the following sections:
By College Factual’s measure, University of Louisville highly for general biology, coming in at #223 out of 1,257 schools nationally.
| Ranking | Rank |
|---|---|
| Best General Biology Schools | 223 of 1,257 |
| Best General Biology Schools in Kentucky | 1 of 18 |
| Best General Biology Schools in the Southeast Region | 30 of 294 |
Here is each degree level available for general biology at University of Louisville, along with how many graduates complete each level annually.
| Degree Level | Annual Graduates |
|---|---|
| Bachelor’s | 130 |
| Master’s | 10 |
| Doctoral | 17 |
In the most recent year for which we have data, University of Louisville conferred 130 bachelor’s degrees in general biology.
University of Louisville is among the very best schools in the country for general biology at the bachelor’s level. Specifically, it ranked #1 out of 18 schools by College Factual.
| Ranking | Rank |
|---|---|
| Best General Biology Bachelor’s Degree Schools in Kentucky | 1 |
| Best General Biology Bachelor’s Degree Schools in the Southeast Region | 27 |
| Best General Biology Bachelor’s Degree Schools | 198 |
General Biology majors who earn their bachelor’s degree from University of Louisville earn a median of $45,398 a year. This is below $66,322, the median for all majors at University of Louisville.
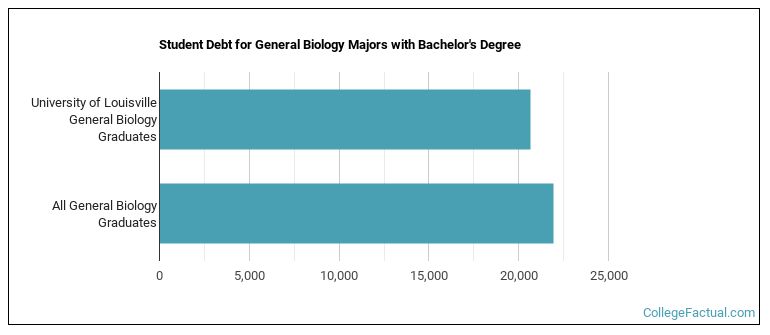
Earning a bachelor’s degree at University of Louisville, general biology graduates take on a median debt of $20,681 in student loans. This is below $21,927, the typical median for all majors at University of Louisville.
Average full-time tuition and fees are listed in the table below.
| In State | Out of State | |
|---|---|---|
| Tuition | $12,174 | $29,286 |
| Fees | $196 | $196 |
Read more about University of Louisville tuition and fees.
Among recent graduates, 42% of general biology bachelor’s degrees went to men and 58% went to women.
 The majority of general biology bachelor’s degree graduates at University of Louisville were White. Approximately 65% of graduates fell into this category.
The following table and chart show the ethnic background for students who recently graduated from University of Louisville with a bachelor’s in general biology.

| Ethnic Background | Number of Students |
|---|---|
| Asian | 18 |
| Black or African American | 11 |
| Hispanic or Latino | 5 |
| White | 85 |
| Non-Resident Aliens | 2 |
| Other Races | 9 |
University of Louisville conferred 130 bachelor’s degrees in biology/biological sciences, general in the most recent reporting year — 58% to women and 42% to men. The most common background among these graduates was White (65%).
This program is also offered at the graduate level at University of Louisville. The following graduate award levels are reported.
| Graduate Level | Annual Graduates |
|---|---|
| Master’s Degrees in General Biology | 10 |
| Doctoral Degrees in General Biology | 17 |
