Here is an overview of this program at University of Louisville. Degrees are awarded at the Bachelor’s, Certificate levels, with graduate study also available. Its best result is a rank of #1 out of 7 schools (Bachelor’s level) by College Factual. Jump to any of the following sections:
College Factual rates University of Louisville among the top schools in the country for teacher education subject specific, placing at #131 out of 554 schools nationally.
Here is each degree level offered in teacher education subject specific at University of Louisville, along with how many graduates complete each level annually.
| Degree Level | Annual Graduates |
|---|---|
| Bachelor’s | 156 |
| Certificate | 83 |
| Master’s | 162 |
| Graduate Certificate | 8 |
For the most recent IPEDS reporting year, University of Louisville awarded 156 bachelor’s degrees in teacher education subject specific.
University of Louisville is among the very best schools in the country for teacher education subject specific at the bachelor’s level. Specifically, it ranked #1 out of 7 schools by College Factual.
Teacher Education Subject Specific students who finish a bachelor’s at University of Louisville earn a median of $52,247 a year. This is below $66,322, the median for all majors at University of Louisville.
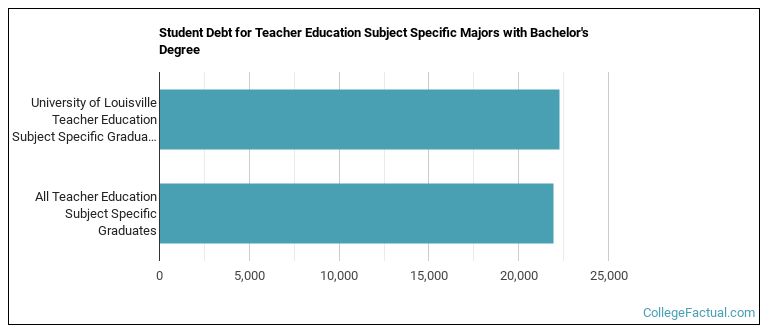
Earning a bachelor’s degree at University of Louisville, teacher education subject specific students borrow a median amount of $22,250 in student loans. This is higher than $21,927, the typical median for all majors at University of Louisville.
The full-time undergraduate tuition and fees are shown below.
| In State | Out of State | |
|---|---|---|
| Tuition | $12,174 | $29,286 |
| Fees | $196 | $196 |
Find out more about University of Louisville tuition and fees.
For the most recent academic year available, 38% of teacher education subject specific bachelor’s degrees went to men and 62% went to women.
 The majority of teacher education subject specific bachelor’s degree graduates at University of Louisville were White. Approximately 74% of graduates fell into this category.
The following table and chart show the ethnic background for students who recently graduated from University of Louisville with a bachelor’s in teacher education subject specific.
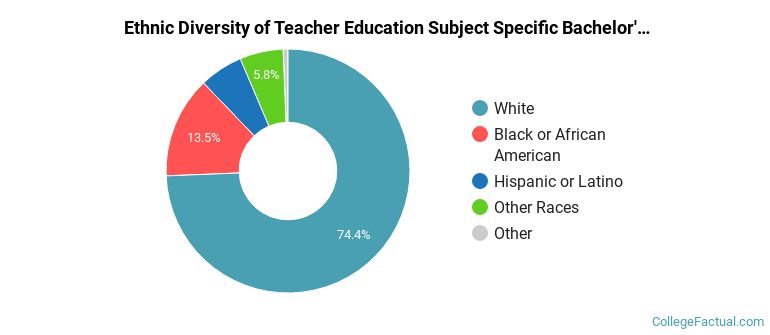
| Ethnic Background | Number of Students |
|---|---|
| Asian | 1 |
| Black or African American | 21 |
| Hispanic or Latino | 9 |
| White | 116 |
| Non-Resident Aliens | 0 |
| Other Races | 9 |
University of Louisville conferred 132 bachelor’s completions in trade and industrial teacher education in the most recent reporting year — 61% to women and 39% to men. The largest share of these graduates were White (73%).
University of Louisville granted 16 bachelor’s completions in music teacher education in the latest year of data — 56% to women and 44% to men. The most common background among these graduates was White (75%).
University of Louisville conferred 5 bachelor’s degrees in mathematics teacher education recently — 60% to women and 40% to men. The most common background among these graduates was White (100%).
University of Louisville conferred 1 bachelor’s degree in biology teacher education in the latest year of data — 100% to women and 0% to men. The largest share of these graduates were White (100%).
University of Louisville conferred 1 bachelor’s degree in chemistry teacher education in the latest year of data — 100% to women and 0% to men. The most common background among these graduates was White (100%).
University of Louisville conferred 1 bachelor’s degree in physics teacher education in the latest year of data — 100% to women and 0% to men. The largest share of these graduates were White (100%).
In the most recent year for which we have data, University of Louisville conferred 83 certificate degrees in teacher education subject specific.
University of Louisville is not currently ranked for teacher education subject specific at the certificate level.
Among recent graduates, 36% of teacher education subject specific certificate degrees went to men and 64% went to women.
 The largest share of teacher education subject specific certificate degree graduates at University of Louisville were White. Approximately 66% of graduates fell into this category.
The following table and chart show the ethnic background for students who recently graduated from University of Louisville with a certificate in teacher education subject specific.

| Ethnic Background | Number of Students |
|---|---|
| Asian | 3 |
| Black or African American | 13 |
| Hispanic or Latino | 6 |
| White | 55 |
| Non-Resident Aliens | 1 |
| Other Races | 5 |
University of Louisville granted 83 certificate completions in trade and industrial teacher education recently — 64% to women and 36% to men. Most of these graduates identified as White (66%).
This program is also offered at the graduate level at University of Louisville. The following graduate award levels are reported.
| Graduate Level | Annual Graduates |
|---|---|
| Master’s Degrees in Teacher Education Subject Specific | 162 |
| Graduate Certificate Degrees in Teacher Education Subject Specific | 8 |
