Here, you'll find out more about the major, including such details as the number of graduates, what degree levels are offered, ethnicity of students, average salaries, and more. Also, learn how UofL ranks among other schools offering degrees in grade specific ed.
Jump to any of the following sections:
UofL was ranked #103 on College Factual's most recent list of the best schools for grade specific ed majors. This puts the bachelor's program at the school solidly in the top 15% of all colleges and universities in the country. It is also ranked #3 in Kentucky.
During the 2021-2022 academic year, University of Louisville handed out 83 bachelor's degrees in teacher education grade specific. This is a decrease of 11% over the previous year when 93 degrees were handed out.
In 2022, 54 students received their master’s degree in grade specific ed from UofL. This makes it the #128 most popular school for grade specific ed master’s degree candidates in the country.
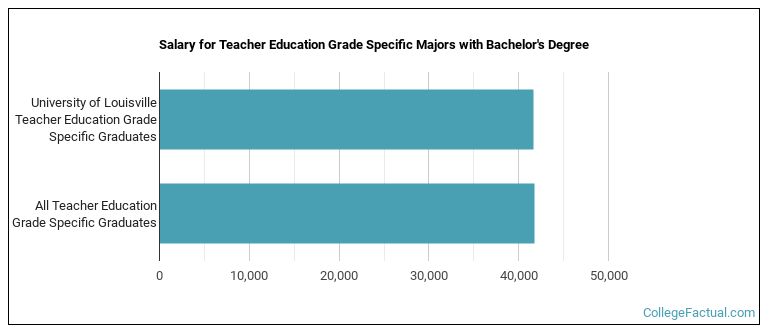
Grade Specific Ed majors who earn their bachelor's degree from UofL go on to jobs where they make a median salary of $41,672 a year. This is less than $41,809, which is the national median of all grade specific ed majors in the nation who earn bachelor's degrees.
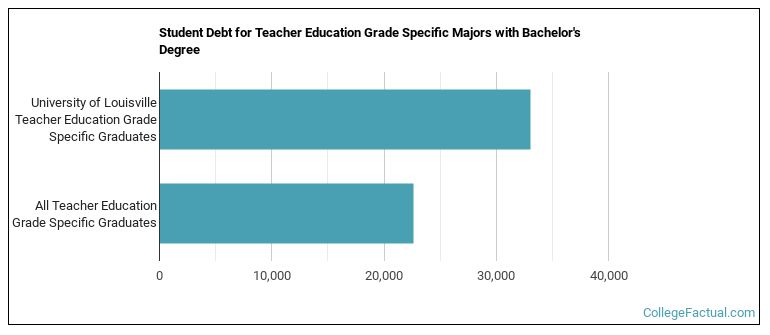
While getting their bachelor's degree at UofL, grade specific ed students borrow a median amount of $33,069 in student loans. This is higher than the the typical median of $22,604 for all grade specific ed majors across the country.
The typical student loan payment of a bachelor's degree student from the grade specific ed program at UofL is $138 per month.
In 2022-2023, the average part-time undergraduate tuition at UofL was $1,208 per credit hour for out-of-state students. The average for in-state students was $527 per credit hour. The following table shows the average full-time tuition and fees for undergraduates.
| In State | Out of State | |
|---|---|---|
| Tuition | $12,632 | $28,978 |
| Fees | $196 | $196 |
| Books and Supplies | $1,274 | $1,274 |
| On Campus Room and Board | $11,690 | $11,690 |
| On Campus Other Expenses | $7,914 | $7,914 |
Learn more about UofL tuition and fees.
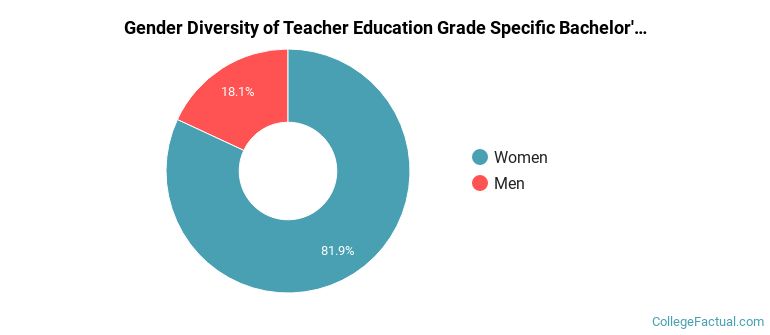
In the 2021-2022 academic year, 83 students earned a bachelor's degree in grade specific ed from UofL. About 82% of these graduates were women and the other 18% were men.
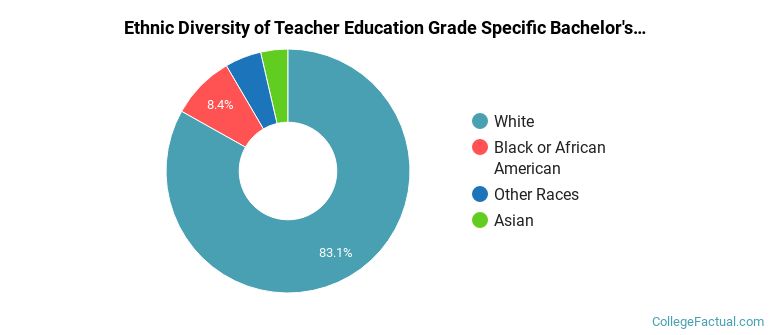
The majority of bachelor's degree recipients in this major at UofL are white. In the most recent graduating class for which data is available, 83% of students fell into this category.
The following table and chart show the ethnic background for students who recently graduated from University of Louisville with a bachelor's in grade specific ed.
| Ethnic Background | Number of Students |
|---|---|
| Asian | 3 |
| Black or African American | 7 |
| Hispanic or Latino | 0 |
| White | 69 |
| Non-Resident Aliens | 0 |
| Other Races | 4 |
Online degrees for the UofL grade specific ed bachelor’s degree program are not available at this time. To see if the school offers distance learning options in other areas, visit the UofL Online Learning page.
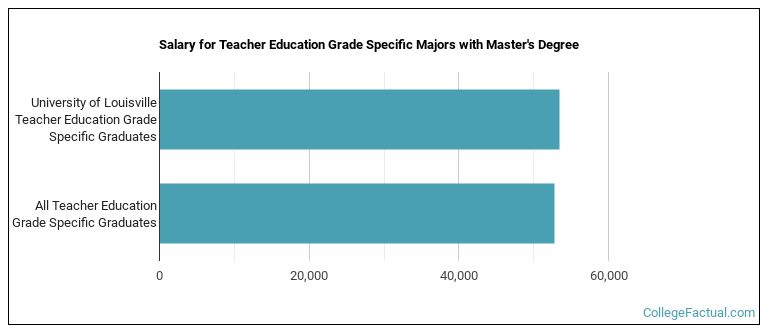
Graduates of the master's grade specific ed program at UofL make a median salary of $53,443. This is a better than average outcome since the median salary for all grade specific ed graduates with a master's is $52,763.
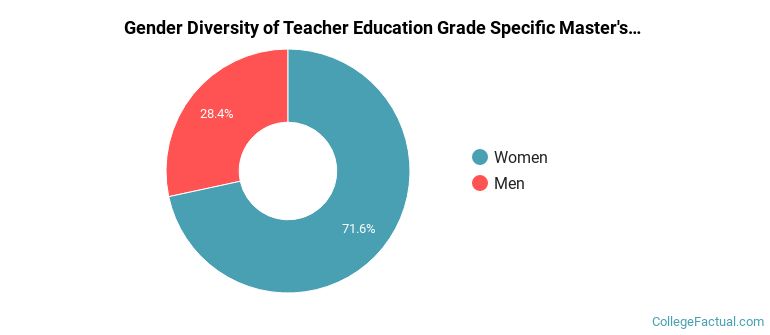
For the most recent academic year available, 28% of grade specific ed master's degrees went to men and 72% went to women.
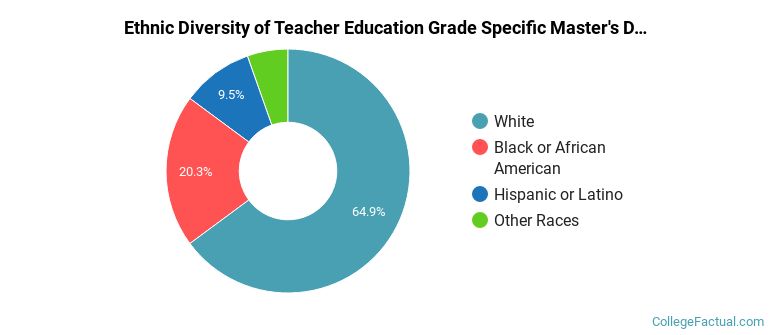
The majority of master's degree recipients in this major at UofL are white. In the most recent graduating class for which data is available, 65% of students fell into this category.
The following table and chart show the ethnic background for students who recently graduated from University of Louisville with a master's in grade specific ed.
| Ethnic Background | Number of Students |
|---|---|
| Asian | 0 |
| Black or African American | 15 |
| Hispanic or Latino | 7 |
| White | 48 |
| Non-Resident Aliens | 0 |
| Other Races | 4 |
Take a look at the following statistics related to the make-up of the grade specific ed majors at University of Louisville.
| Related Major | Annual Graduates |
|---|---|
| Teacher Education Subject Specific | 428 |
| Educational Administration | 223 |
| Student Counseling | 57 |
| Special Education | 22 |
| Curriculum & Instruction | 7 |
More about our data sources and methodologies.