UofL total enrollment is approximately 22,211 students. 11,598 are undergraduates and 4,311 are graduate students.
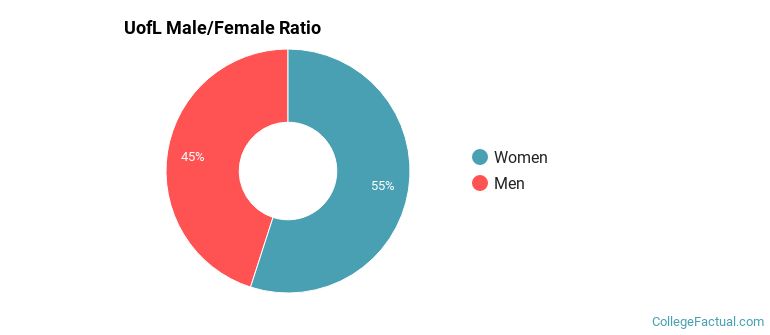
Male/Female Breakdown of Undergraduates
The full-time UofL undergraduate population is made up of 55% women, and 45% men.
For the gender breakdown for all students, go here.
UofL Racial/Ethnic Breakdown of Undergraduates
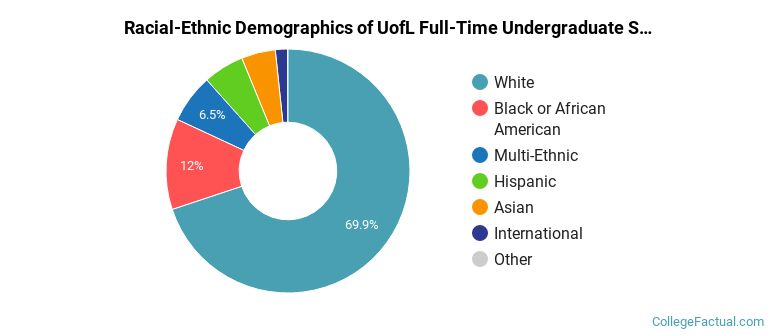
| Race/Ethnicity | Number |
|---|---|
| White | 7,891 |
| Black or African American | 1,492 |
| Multi-Ethnic | 754 |
| Hispanic | 700 |
| Asian | 583 |
| International | 151 |
| Unknown | 11 |
| Native Hawaiian or Pacific Islander | 4 |
See racial/ethnic breakdown for all students.
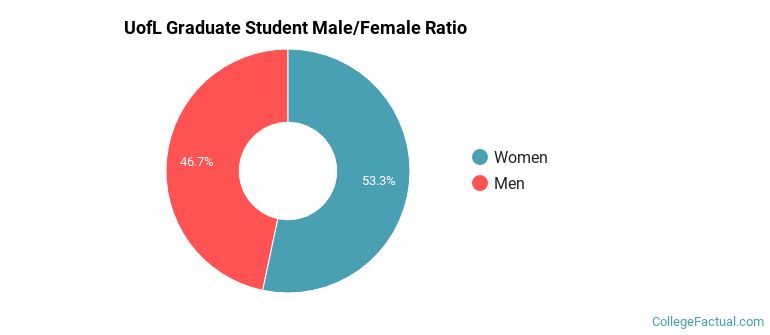
Male/Female Breakdown of Graduate Students
About 54% of full-time grad students are women, and 46% men.
For the gender breakdown for all students, go here.
UofL Racial-Ethnic Breakdown of Graduate Students
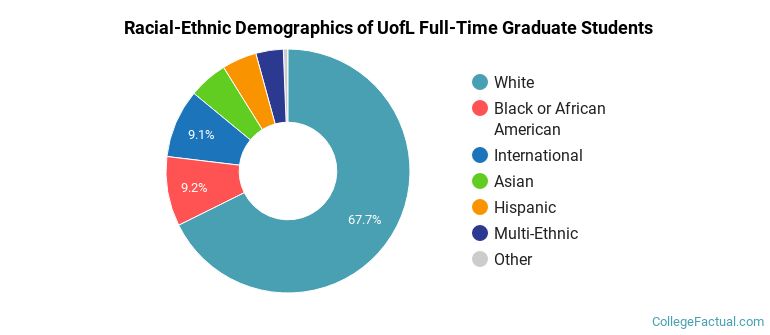
| Race/Ethnicity | Number |
|---|---|
| White | 2,923 |
| Black or African American | 432 |
| International | 333 |
| Asian | 229 |
| Hispanic | 193 |
| Multi-Ethnic | 170 |
| Unknown | 26 |
| Native Hawaiian or Pacific Islander | 1 |
See racial/ethnic breakdown for all students.

| Race/Ethnicity | Number |
|---|---|
| White | 15,129 |
| Black or African American | 2,759 |
| Hispanic | 1,288 |
| Multi-Ethnic | 1,230 |
| Asian | 1,103 |
| International | 611 |
| Unknown | 56 |
| Native Hawaiian or Pacific Islander | 9 |
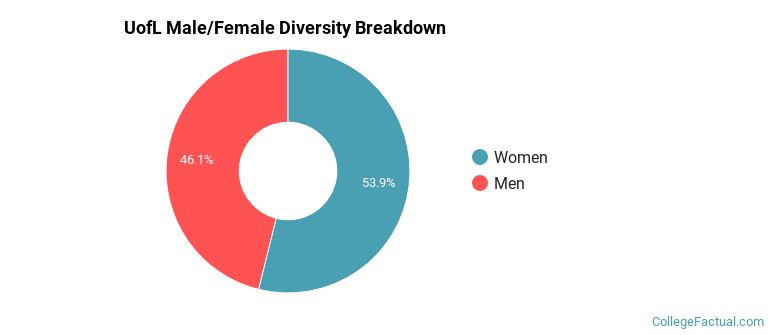
There are approximately 12,150 female students and 10,061 male students at UofL.
UofL ranks 806 out of 2,183 when it comes to geographic diversity.
17.47% of UofL students come from out of state, and 0.9% come from out of the country.
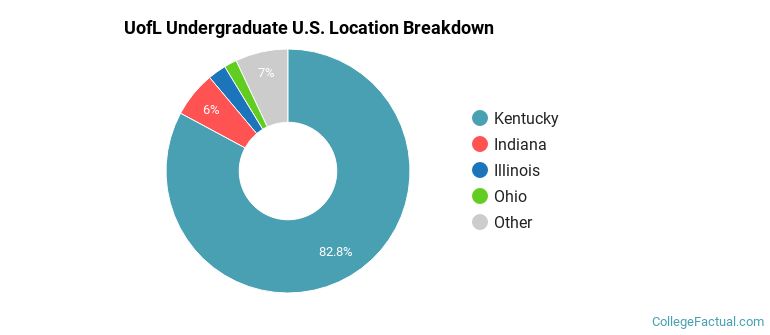
The undergraduate student body is split among 34 states (may include Washington D.C.). Click on the map for more detail.

| State | Amount |
|---|---|
| Kentucky | 2,357 |
| Indiana | 172 |
| Illinois | 69 |
| Ohio | 48 |
| Michigan | 17 |
Students from 81 countries are represented at this school, with the majority of the international students coming from India, China, and Iran.
Learn more about international students at UofL.
A traditional college student is defined as being between the ages of 18-21. At UofL, 46.15% of students fall into that category, compared to the national average of 60%.
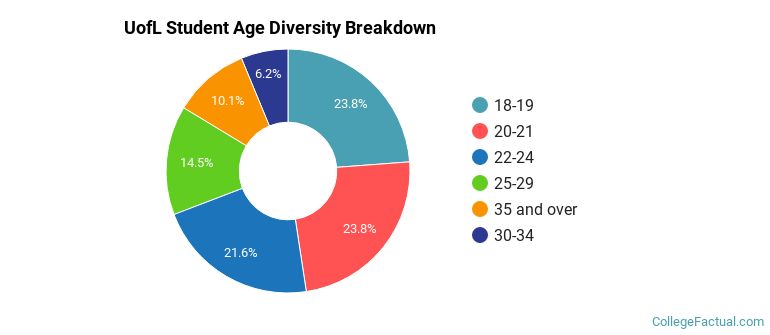
| Student Age Group | Amount |
|---|---|
| 18-19 | 4,940 |
| 20-21 | 4,936 |
| 22-24 | 4,481 |
| 25-29 | 3,002 |
| 35 and over | 2,096 |
| 30-34 | 1,294 |
| Under 18 | 0 |
Footnotes
*The racial-ethnic minorities count is calculated by taking the total number of students and subtracting white students, international students, and students whose race/ethnicity was unknown. This number is then divided by the total number of students at the school to obtain the racial-ethnic minorities percentage.
References
Department of Homeland Security Citizenship and Immigration Services
Find out how College Factual created their Diversity Rankings.