Here, you'll find out more about the major, including such details as the number of graduates, what degree levels are offered, ethnicity of students, and more. In addition, we cover how UMA ranks in comparison to other schools with library science programs.
Go directly to any of the following sections:
The bachelor's program at UMA was ranked #4 on College Factual's Best Schools for library science list. It is also ranked #1 in Maine.
| Ranking Type | Rank |
|---|---|
| Best Library & Information Science Schools | 4 |
| Best Library & Information Science Bachelor’s Degree Schools | 4 |
During the 2021-2022 academic year, University of Maine at Augusta handed out 28 bachelor's degrees in library & information science. This is an increase of 12% over the previous year when 25 degrees were handed out.
During the 2022-2023 academic year, part-time undergraduate students at UMA paid an average of $683 per credit hour if they came to the school from out-of-state. In-state students paid a discounted rate of $252 per credit hour. The following table shows the average full-time tuition and fees for undergraduates.
| In State | Out of State | |
|---|---|---|
| Tuition | $7,560 | $20,490 |
| Fees | $1,058 | $1,058 |
| Books and Supplies | $1,200 | $1,200 |
| On Campus Room and Board | $8,700 | $8,700 |
| On Campus Other Expenses | $3,600 | $3,600 |
Learn more about UMA tuition and fees.
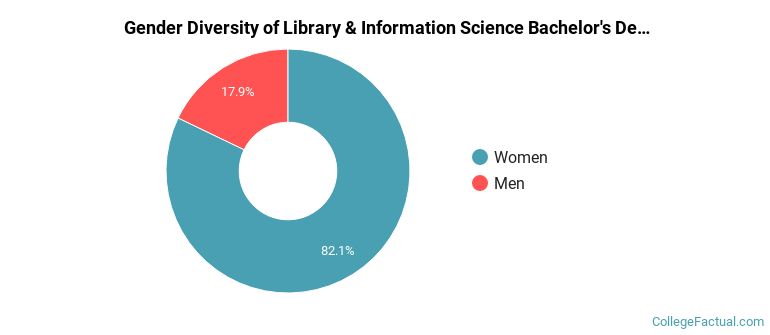
Of the 28 students who earned a bachelor's degree in Library & Information Science from UMA in 2021-2022, 18% were men and 82% were women.
The majority of bachelor's degree recipients in this major at UMA are white. In the most recent graduating class for which data is available, 71% of students fell into this category.
The following table and chart show the ethnic background for students who recently graduated from University of Maine at Augusta with a bachelor's in library science.
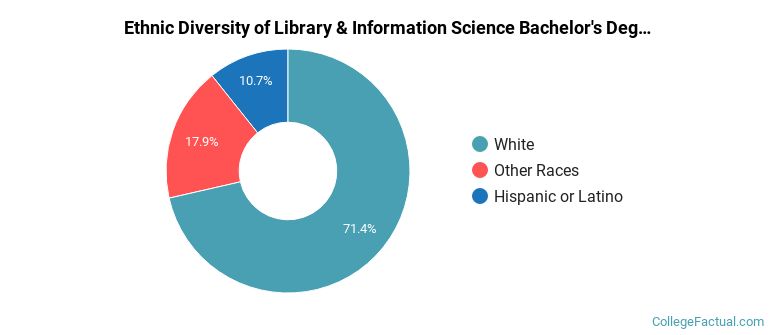
| Ethnic Background | Number of Students |
|---|---|
| Asian | 0 |
| Black or African American | 0 |
| Hispanic or Latino | 3 |
| White | 20 |
| Non-Resident Aliens | 0 |
| Other Races | 5 |
Online degrees for the UMA library science bachelor’s degree program are not available at this time. To see if the school offers distance learning options in other areas, visit the UMA Online Learning page.
Take a look at the following statistics related to the make-up of the library science majors at University of Maine at Augusta.
| Related Major | Annual Graduates |
|---|---|
| Library & Archives Assisting | 16 |