UMB total enrollment is approximately 7,137 students. 707 are undergraduates and 4,372 are graduate students.
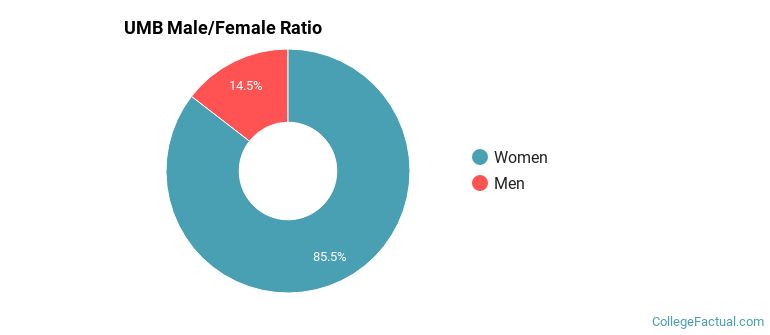
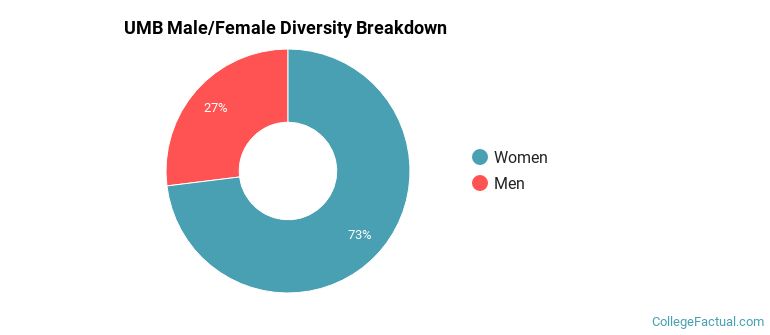
Male/Female Breakdown of Undergraduates
The full-time UMB undergraduate population is made up of 82% women, and 18% men.
For the gender breakdown for all students, go here.
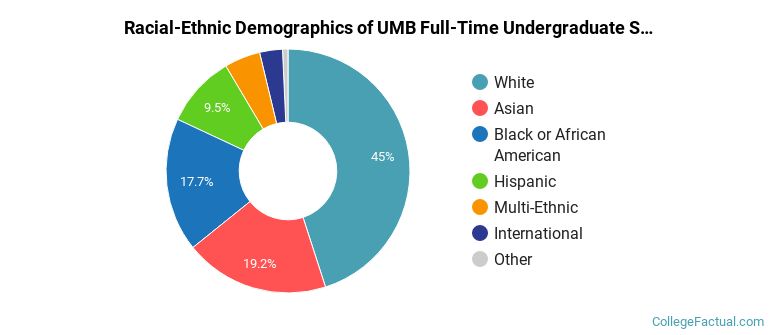
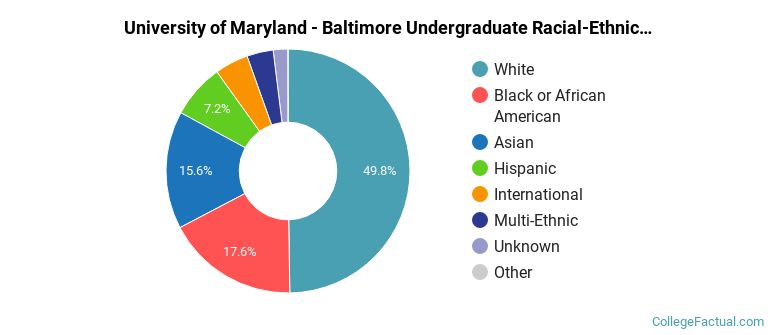
UMB Racial/Ethnic Breakdown of Undergraduates
| Race/Ethnicity | Number |
|---|---|
| White | 283 |
| Black or African American | 157 |
| Asian | 125 |
| Hispanic | 79 |
| Multi-Ethnic | 30 |
| International | 25 |
| Unknown | 7 |
| Native Hawaiian or Pacific Islander | 0 |
See racial/ethnic breakdown for all students.
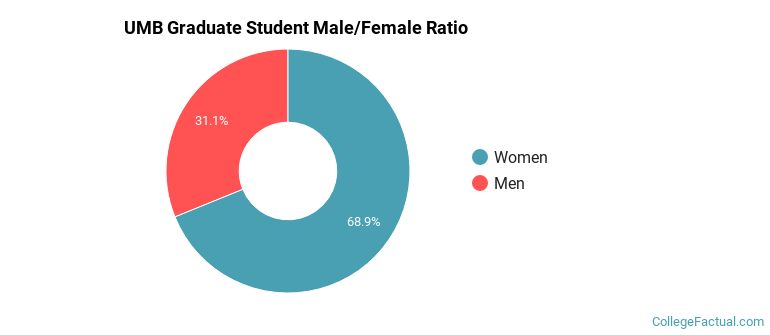
Male/Female Breakdown of Graduate Students
About 70% of full-time grad students are women, and 30% men.
For the gender breakdown for all students, go here.
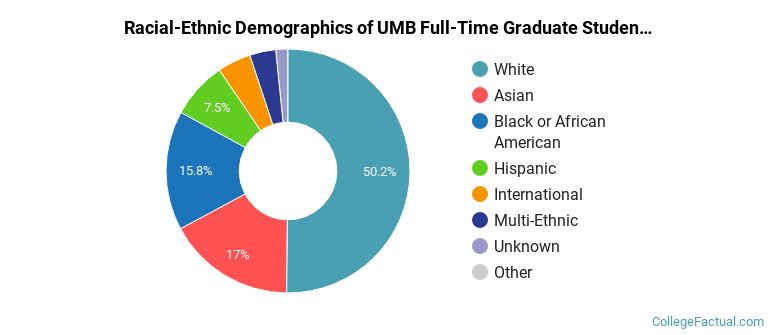
UMB Racial-Ethnic Breakdown of Graduate Students
| Race/Ethnicity | Number |
|---|---|
| White | 2,172 |
| Asian | 731 |
| Black or African American | 712 |
| Hispanic | 347 |
| International | 194 |
| Multi-Ethnic | 151 |
| Unknown | 62 |
| Native Hawaiian or Pacific Islander | 0 |
See racial/ethnic breakdown for all students.
| Race/Ethnicity | Number |
|---|---|
| White | 3,480 |
| Black or African American | 1,286 |
| Asian | 1,089 |
| Hispanic | 560 |
| International | 317 |
| Multi-Ethnic | 263 |
| Unknown | 134 |
| Native Hawaiian or Pacific Islander | 2 |
There are approximately 5,215 female students and 1,922 male students at UMB.
Students from 48 countries are represented at this school, with the majority of the international students coming from China, India, and South Korea.
Learn more about international students at UMB.
A traditional college student is defined as being between the ages of 18-21. At UMB, 5.50% of students fall into that category, compared to the national average of 60%.
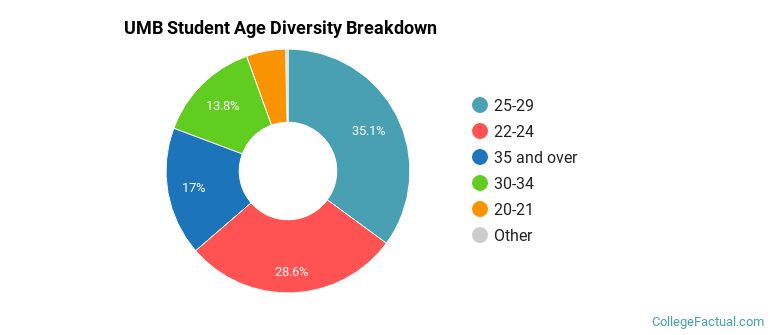
| Student Age Group | Amount |
|---|---|
| 25-29 | 2,347 |
| 22-24 | 1,912 |
| 35 and over | 1,139 |
| 30-34 | 923 |
| 20-21 | 348 |
| 18-19 | 21 |
| Under 18 | 0 |
Footnotes
*The racial-ethnic minorities count is calculated by taking the total number of students and subtracting white students, international students, and students whose race/ethnicity was unknown. This number is then divided by the total number of students at the school to obtain the racial-ethnic minorities percentage.
References
Department of Homeland Security Citizenship and Immigration Services
Image Credit: By Acroterion under License
Read College Factual's Diversity Ranking Methodology.