UMGC total enrollment is approximately 58,526 students. 10,425 are undergraduates and 136 are graduate students.
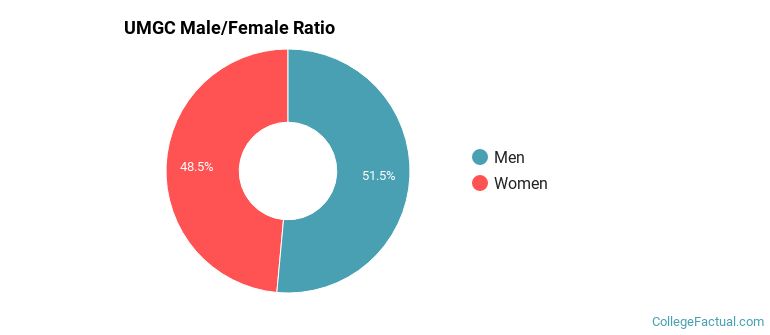
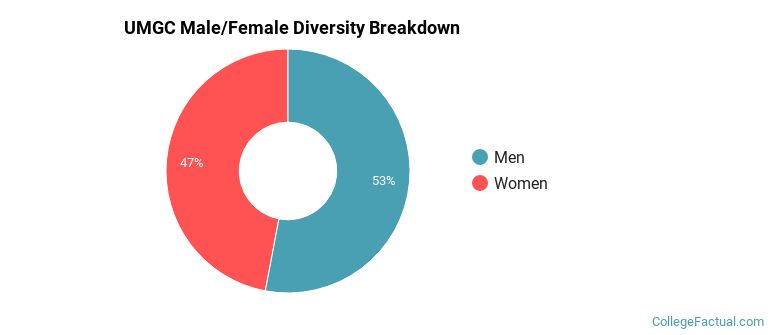
Male/Female Breakdown of Undergraduates
The full-time UMGC undergraduate population is made up of 49% women, and 51% men.
For the gender breakdown for all students, go here.
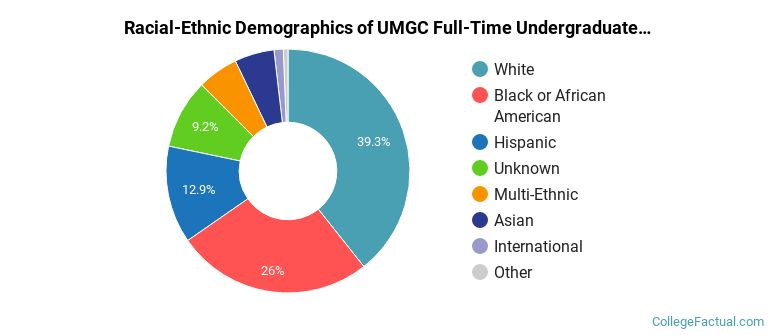
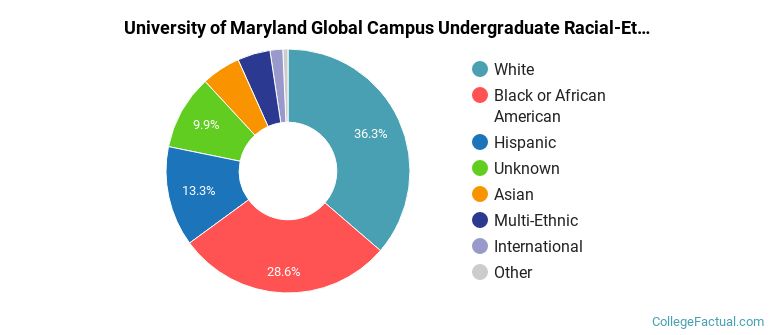
UMGC Racial/Ethnic Breakdown of Undergraduates
| Race/Ethnicity | Number |
|---|---|
| White | 4,089 |
| Black or African American | 2,680 |
| Hispanic | 1,417 |
| Unknown | 869 |
| Asian | 568 |
| Multi-Ethnic | 559 |
| International | 136 |
| Native Hawaiian or Pacific Islander | 70 |
See racial/ethnic breakdown for all students.
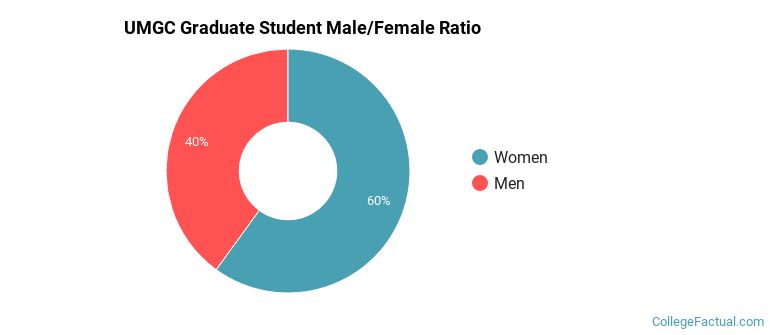
Male/Female Breakdown of Graduate Students
About 54% of full-time grad students are women, and 46% men.
For the gender breakdown for all students, go here.
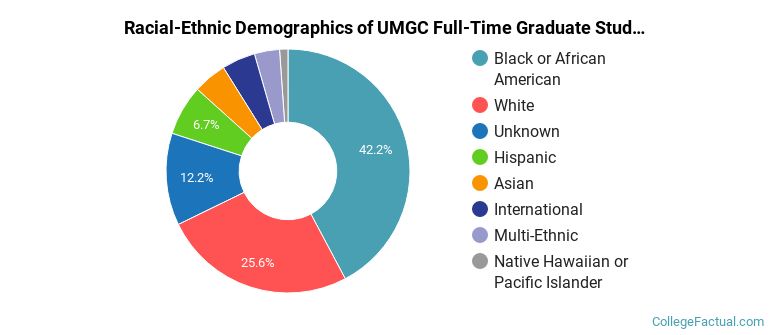
UMGC Racial-Ethnic Breakdown of Graduate Students
| Race/Ethnicity | Number |
|---|---|
| Black or African American | 53 |
| White | 43 |
| Unknown | 14 |
| Hispanic | 9 |
| Asian | 8 |
| Multi-Ethnic | 7 |
| International | 2 |
| Native Hawaiian or Pacific Islander | 0 |
See racial/ethnic breakdown for all students.
| Race/Ethnicity | Number |
|---|---|
| White | 21,226 |
| Black or African American | 16,336 |
| Hispanic | 8,165 |
| Unknown | 5,275 |
| Asian | 3,153 |
| Multi-Ethnic | 2,619 |
| International | 1,063 |
| Native Hawaiian or Pacific Islander | 419 |
There are approximately 27,640 female students and 30,886 male students at UMGC.
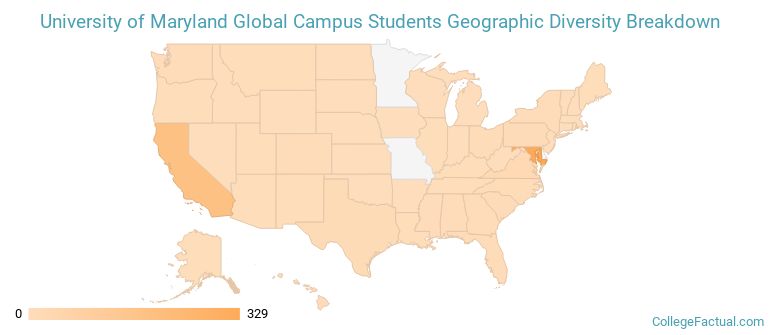
UMGC ranks 279 out of 2,183 when it comes to geographic diversity.
39.98% of UMGC students come from out of state, and 4.55% come from out of the country.
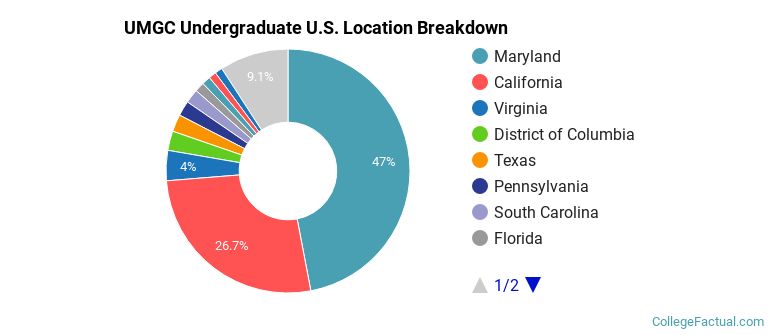
The undergraduate student body is split among 36 states (may include Washington D.C.). Click on the map for more detail.
| State | Amount |
|---|---|
| Maryland | 329 |
| California | 187 |
| Virginia | 28 |
| District of Columbia | 18 |
| Texas | 16 |
Learn more about international students at UMGC.
A traditional college student is defined as being between the ages of 18-21. At UMGC, 7.34% of students fall into that category, compared to the national average of 60%.
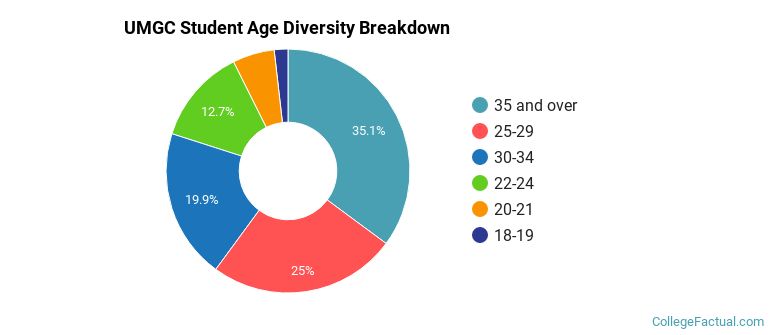
| Student Age Group | Amount |
|---|---|
| 35 and over | 20,776 |
| 25-29 | 14,763 |
| 30-34 | 11,753 |
| 22-24 | 7,507 |
| 20-21 | 3,282 |
| 18-19 | 1,076 |
| Under 18 | 0 |
Footnotes
*The racial-ethnic minorities count is calculated by taking the total number of students and subtracting white students, international students, and students whose race/ethnicity was unknown. This number is then divided by the total number of students at the school to obtain the racial-ethnic minorities percentage.
References
Department of Homeland Security Citizenship and Immigration Services
Image Credit: By M Chambers under License
Learn more about how College Factual creates their Diversity Rankings.