Here, you'll find out more about the major, including such details as the number of graduates, what degree levels are offered, ethnicity of students, average salaries, and more. In addition, we cover how UMass Boston ranks in comparison to other schools with ee programs.
Jump to any of the following sections:
The bachelor's program at UMass Boston was ranked #237 on College Factual's Best Schools for ee list. It is also ranked #12 in Massachusetts.
| Ranking Type | Rank |
|---|---|
| Best Electrical Engineering Bachelor’s Degree Schools | 233 |
| Best Electrical Engineering Schools | 237 |
During the 2021-2022 academic year, University of Massachusetts - Boston handed out 30 bachelor's degrees in electrical engineering. This is an increase of 114% over the previous year when 14 degrees were handed out.
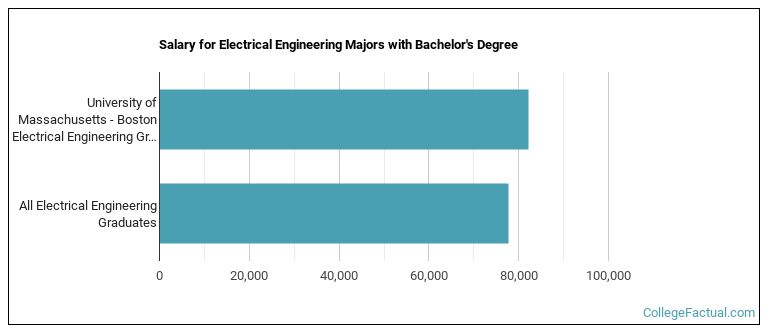
EE majors who earn their bachelor's degree from UMass Boston go on to jobs where they make a median salary of $82,118 a year. This is great news for graduates of the program, since this figure is higher than the national average of $77,687 for all ee bachelor's degree recipients.
During the 2022-2023 academic year, part-time undergraduate students at UMass Boston paid an average of $1,548 per credit hour if they came to the school from out-of-state. In-state students paid a discounted rate of $645 per credit hour. The following table shows the average full-time tuition and fees for undergraduates.
| In State | Out of State | |
|---|---|---|
| Tuition | $14,905 | $36,581 |
| Fees | $590 | $590 |
| Books and Supplies | $1,000 | $1,000 |
| On Campus Room and Board | $17,512 | $17,512 |
| On Campus Other Expenses | $3,066 | $3,066 |
Learn more about UMass Boston tuition and fees.
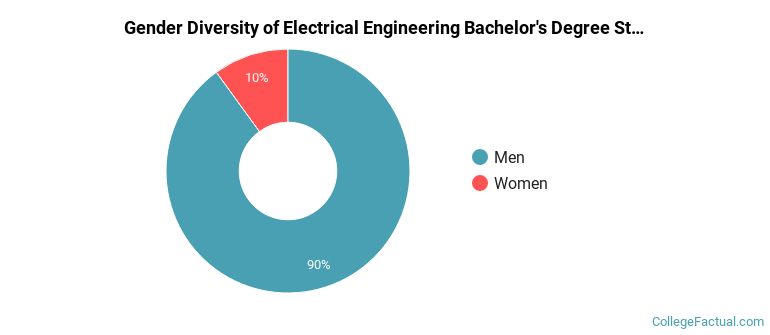
For the most recent academic year available, 90% of ee bachelor's degrees went to men and 10% went to women.
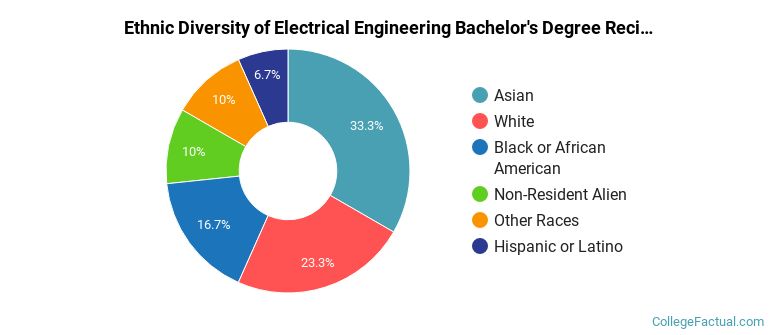
The following table and chart show the ethnic background for students who recently graduated from University of Massachusetts - Boston with a bachelor's in ee.
| Ethnic Background | Number of Students |
|---|---|
| Asian | 10 |
| Black or African American | 5 |
| Hispanic or Latino | 2 |
| White | 7 |
| Non-Resident Aliens | 3 |
| Other Races | 3 |
Online degrees for the UMass Boston ee bachelor’s degree program are not available at this time. To see if the school offers distance learning options in other areas, visit the UMass Boston Online Learning page.
Take a look at the following statistics related to the make-up of the ee majors at University of Massachusetts - Boston.
| Related Major | Annual Graduates |
|---|---|
| Computer Engineering | 8 |
| Engineering Physics | 3 |
More about our data sources and methodologies.