UMass Dartmouth total enrollment is approximately 7,869 students. 5,122 are undergraduates and 738 are graduate students.
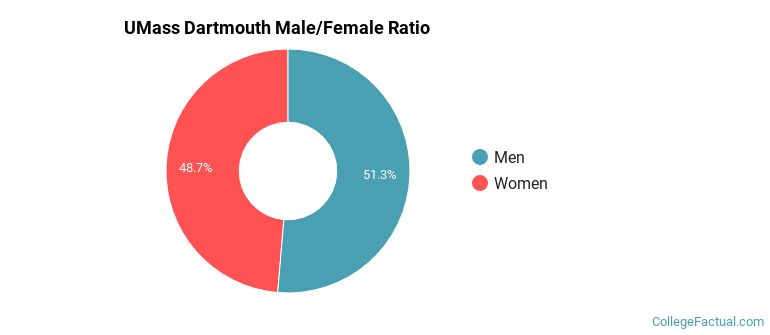
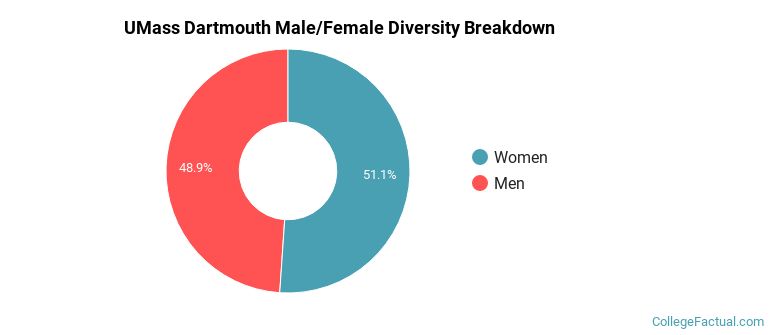
Male/Female Breakdown of Undergraduates
The full-time UMass Dartmouth undergraduate population is made up of 50% women, and 50% men.
For the gender breakdown for all students, go here.
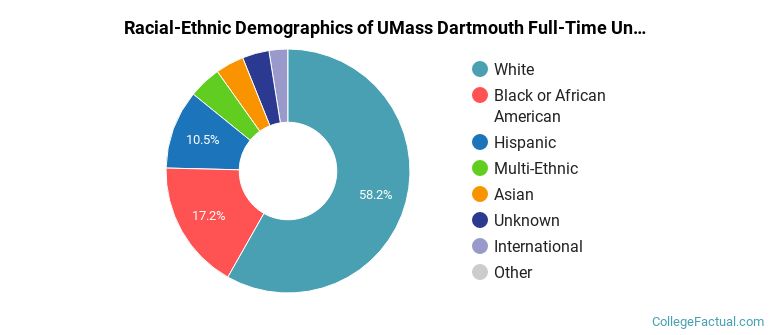
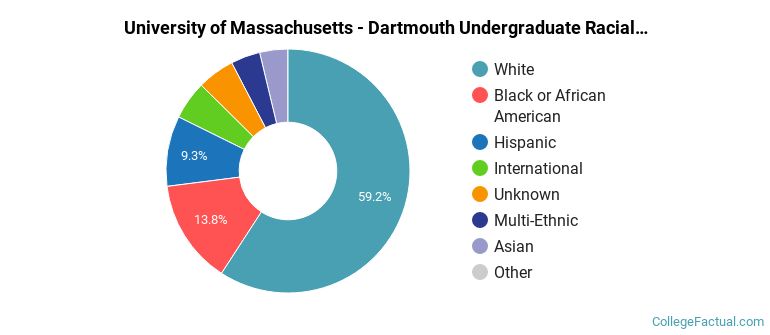
UMass Dartmouth Racial/Ethnic Breakdown of Undergraduates
| Race/Ethnicity | Number |
|---|---|
| White | 3,016 |
| Black or African American | 872 |
| Hispanic | 562 |
| Multi-Ethnic | 260 |
| Unknown | 169 |
| Asian | 154 |
| International | 86 |
| Native Hawaiian or Pacific Islander | 1 |
See racial/ethnic breakdown for all students.
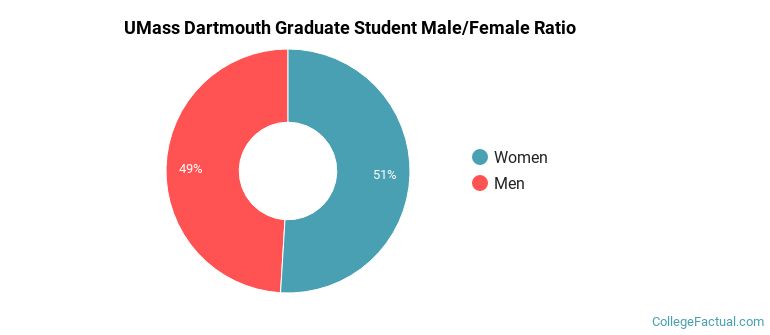
Male/Female Breakdown of Graduate Students
About 51% of full-time grad students are women, and 49% men.
For the gender breakdown for all students, go here.
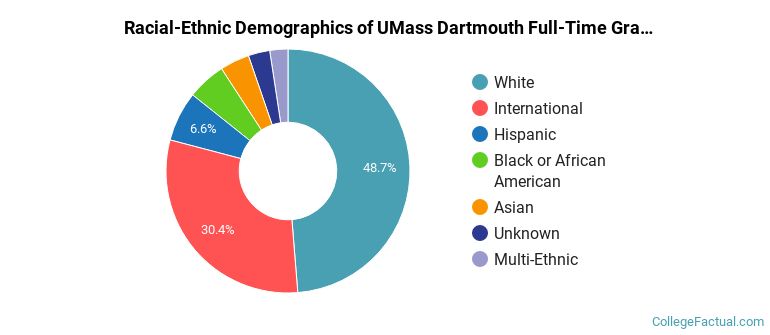
UMass Dartmouth Racial-Ethnic Breakdown of Graduate Students
| Race/Ethnicity | Number |
|---|---|
| White | 402 |
| International | 153 |
| Hispanic | 55 |
| Black or African American | 40 |
| Asian | 35 |
| Unknown | 27 |
| Multi-Ethnic | 22 |
| Native Hawaiian or Pacific Islander | 0 |
See racial/ethnic breakdown for all students.
| Race/Ethnicity | Number |
|---|---|
| White | 4,717 |
| Black or African American | 1,075 |
| Hispanic | 774 |
| Multi-Ethnic | 353 |
| Unknown | 337 |
| International | 321 |
| Asian | 280 |
| Native Hawaiian or Pacific Islander | 1 |
There are approximately 4,087 female students and 3,782 male students at UMass Dartmouth.
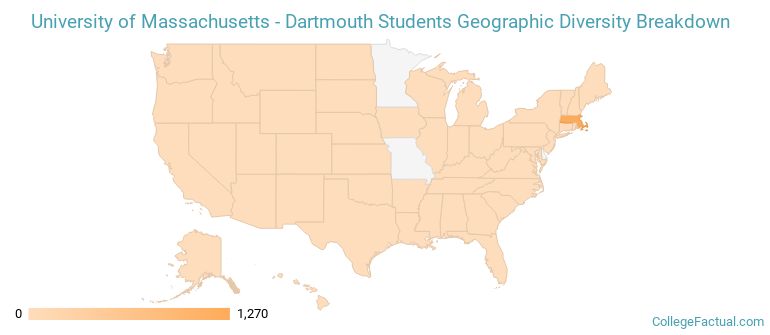
UMass Dartmouth ranks 1,642 out of 2,183 when it comes to geographic diversity.
5.78% of UMass Dartmouth students come from out of state, and 1.1% come from out of the country.
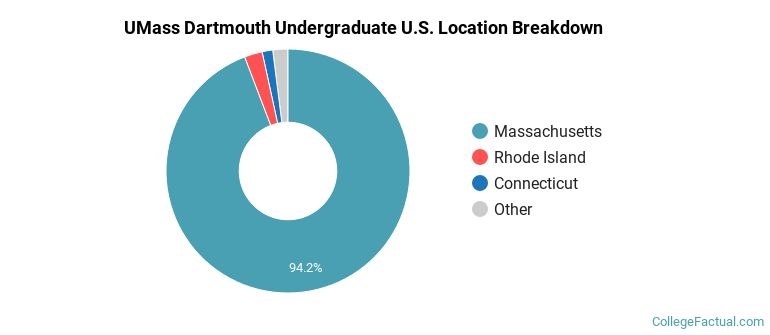
The undergraduate student body is split among 15 states (may include Washington D.C.). Click on the map for more detail.
| State | Amount |
|---|---|
| Massachusetts | 1,270 |
| Rhode Island | 32 |
| Connecticut | 19 |
| New Hampshire | 8 |
| New York | 4 |
Students from 52 countries are represented at this school, with the majority of the international students coming from India, China, and Pakistan.
Learn more about international students at UMass Dartmouth.
A traditional college student is defined as being between the ages of 18-21. At UMass Dartmouth, 49.01% of students fall into that category, compared to the national average of 60%.
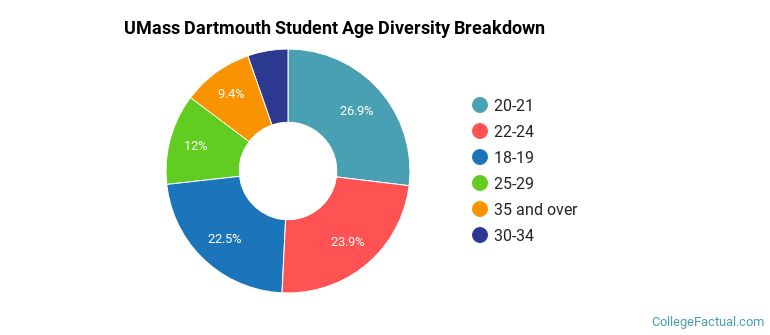
| Student Age Group | Amount |
|---|---|
| 20-21 | 2,246 |
| 22-24 | 1,990 |
| 18-19 | 1,874 |
| 25-29 | 1,003 |
| 35 and over | 783 |
| 30-34 | 446 |
| Under 18 | 0 |
Footnotes
*The racial-ethnic minorities count is calculated by taking the total number of students and subtracting white students, international students, and students whose race/ethnicity was unknown. This number is then divided by the total number of students at the school to obtain the racial-ethnic minorities percentage.
References
Department of Homeland Security Citizenship and Immigration Services
Image Credit: By User: LGagnon under License