Here, you'll find out more about the major, including such details as the number of graduates, what degree levels are offered, ethnicity of students, average salaries, and more. Also, learn how UofM ranks among other schools offering degrees in mis.
Jump to any of the following sections:
The bachelor's program at UofM was ranked #100 on College Factual's Best Schools for mis list. It is also ranked #1 in Tennessee.
During the 2021-2022 academic year, University of Memphis handed out 50 bachelor's degrees in management information systems. This is a decrease of 15% over the previous year when 59 degrees were handed out.
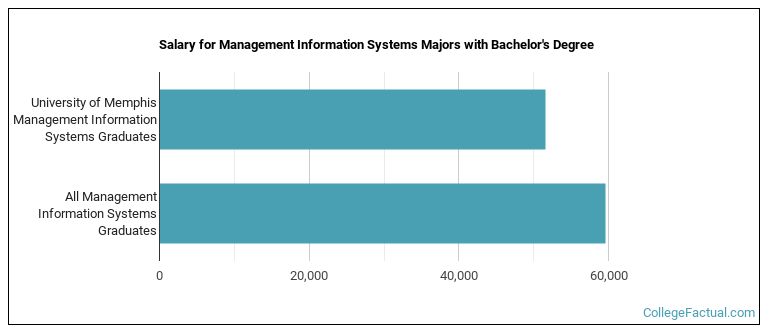
MIS majors who earn their bachelor's degree from UofM go on to jobs where they make a median salary of $51,524 a year. This is less than $59,606, which is the national median of all mis majors in the nation who earn bachelor's degrees.
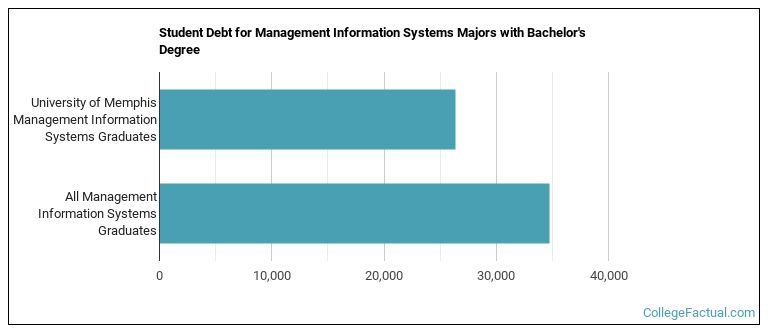
While getting their bachelor's degree at UofM, mis students borrow a median amount of $26,351 in student loans. This is not too bad considering that the median debt load of all mis bachelor's degree recipients across the country is $34,724.
Out-of-state part-time undergraduates at UofM paid an average of $540 per credit hour in 2022-2023. The average for in-state students was $355 per credit hour. Information about average full-time undergraduate tuition and fees is shown in the table below.
| In State | Out of State | |
|---|---|---|
| Tuition | $8,520 | $12,960 |
| Fees | $1,824 | $1,824 |
| Books and Supplies | $920 | $920 |
| On Campus Room and Board | $10,344 | $10,344 |
| On Campus Other Expenses | $6,462 | $6,462 |
Learn more about UofM tuition and fees.
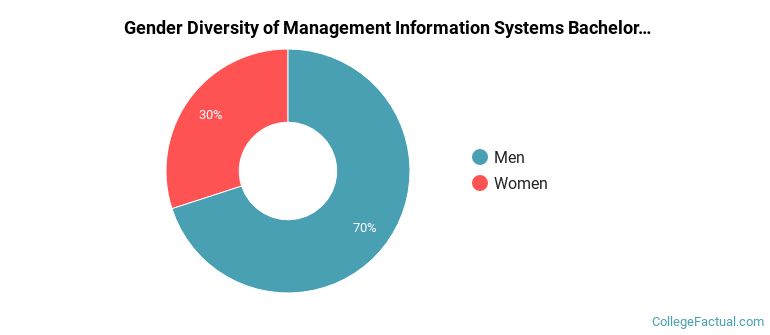
During the 2021-2022 academic year, 50 students graduated with a bachelor's degree in mis from UofM. About 70% were men and 30% were women.
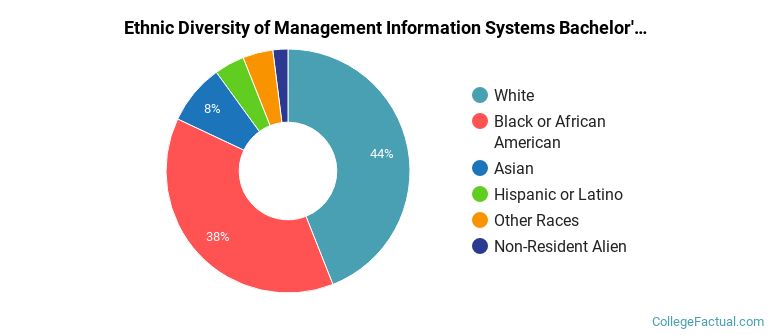
The following table and chart show the ethnic background for students who recently graduated from University of Memphis with a bachelor's in mis.
| Ethnic Background | Number of Students |
|---|---|
| Asian | 4 |
| Black or African American | 19 |
| Hispanic or Latino | 2 |
| White | 22 |
| Non-Resident Aliens | 1 |
| Other Races | 2 |
UofM does not offer an online option for its mis bachelor’s degree program at this time. To see if the school offers distance learning options in other areas, visit the UofM Online Learning page.
Take a look at the following statistics related to the make-up of the mis majors at University of Memphis.
| Related Major | Annual Graduates |
|---|---|
| Business Administration & Management | 356 |
| Accounting | 129 |
| Finance & Financial Management | 102 |
| Marketing | 92 |
| Management Sciences & Quantitative Methods | 57 |
More about our data sources and methodologies.