UofM total enrollment is approximately 22,205 students. 12,063 are undergraduates and 2,128 are graduate students.
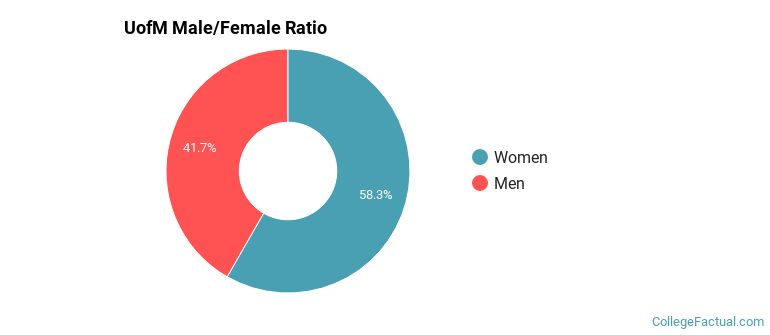
Male/Female Breakdown of Undergraduates
The full-time UofM undergraduate population is made up of 60% women, and 40% men.
For the gender breakdown for all students, go here.
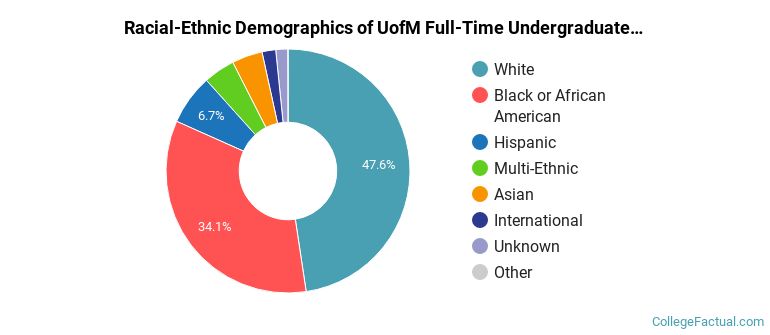
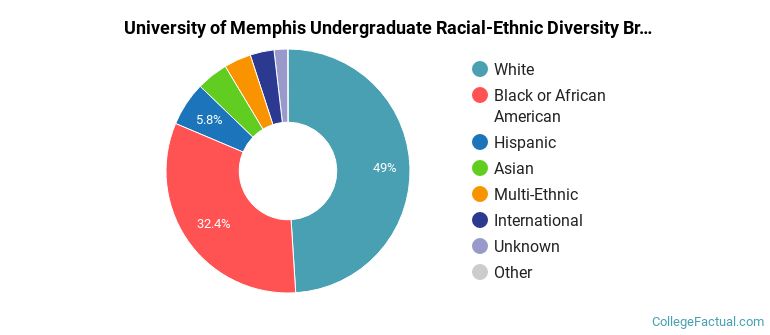
UofM Racial/Ethnic Breakdown of Undergraduates
| Race/Ethnicity | Number |
|---|---|
| White | 5,576 |
| Black or African American | 4,225 |
| Hispanic | 919 |
| Multi-Ethnic | 467 |
| Asian | 462 |
| Unknown | 199 |
| International | 190 |
| Native Hawaiian or Pacific Islander | 0 |
See racial/ethnic breakdown for all students.
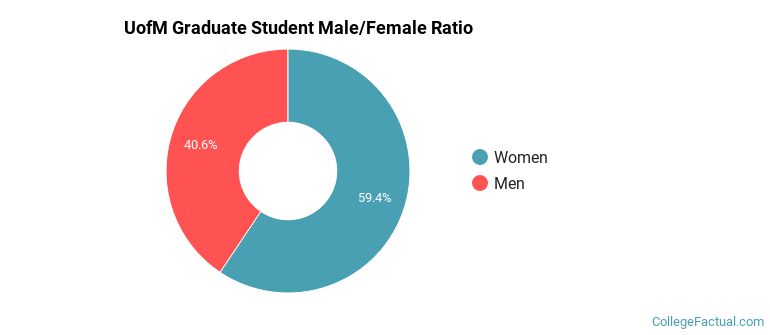
Male/Female Breakdown of Graduate Students
About 62% of full-time grad students are women, and 38% men.
For the gender breakdown for all students, go here.
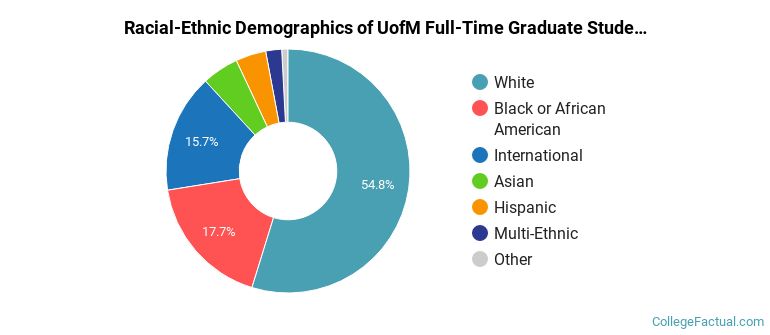
UofM Racial-Ethnic Breakdown of Graduate Students
| Race/Ethnicity | Number |
|---|---|
| White | 1,127 |
| Black or African American | 457 |
| International | 282 |
| Asian | 98 |
| Hispanic | 96 |
| Multi-Ethnic | 50 |
| Unknown | 13 |
| Native Hawaiian or Pacific Islander | 0 |
See racial/ethnic breakdown for all students.
| Race/Ethnicity | Number |
|---|---|
| White | 10,576 |
| Black or African American | 7,431 |
| Hispanic | 1,436 |
| Asian | 946 |
| Multi-Ethnic | 741 |
| International | 640 |
| Unknown | 380 |
| Native Hawaiian or Pacific Islander | 6 |

There are approximately 13,537 female students and 8,668 male students at UofM.
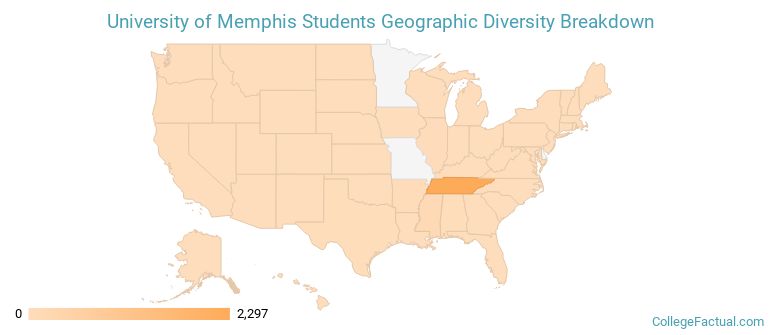
UofM ranks 919 out of 2,183 when it comes to geographic diversity.
15.08% of UofM students come from out of state, and 1.39% come from out of the country.
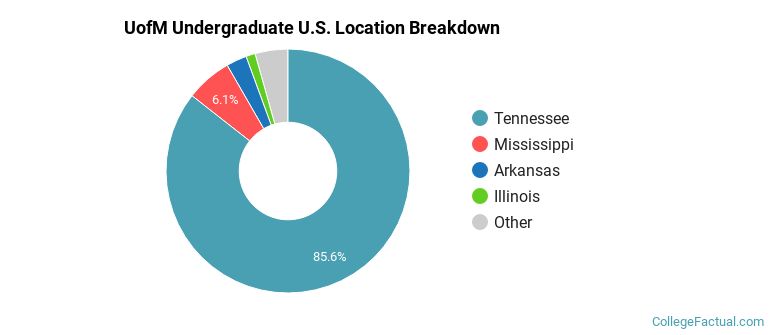
The undergraduate student body is split among 32 states (may include Washington D.C.). Click on the map for more detail.
| State | Amount |
|---|---|
| Tennessee | 2,297 |
| Mississippi | 164 |
| Arkansas | 73 |
| Illinois | 33 |
| Alabama | 21 |
Students from 83 countries are represented at this school, with the majority of the international students coming from India, Saudi Arabia, and China.
Learn more about international students at UofM.
A traditional college student is defined as being between the ages of 18-21. At UofM, 41.06% of students fall into that category, compared to the national average of 60%.
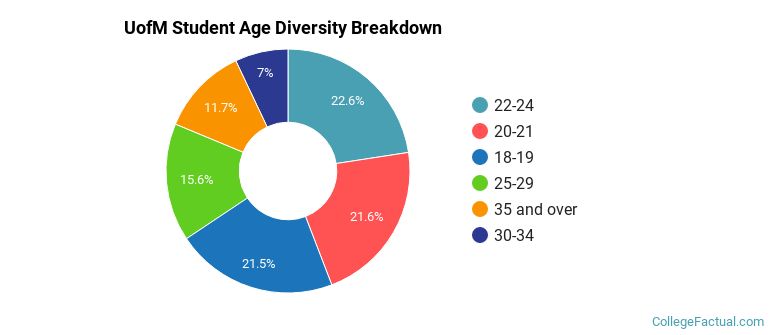
| Student Age Group | Amount |
|---|---|
| 22-24 | 4,629 |
| 20-21 | 4,430 |
| 18-19 | 4,407 |
| 25-29 | 3,208 |
| 35 and over | 2,398 |
| 30-34 | 1,444 |
| Under 18 | 0 |
Footnotes
*The racial-ethnic minorities count is calculated by taking the total number of students and subtracting white students, international students, and students whose race/ethnicity was unknown. This number is then divided by the total number of students at the school to obtain the racial-ethnic minorities percentage.
References
Department of Homeland Security Citizenship and Immigration Services
Image Credit: By BenSherman under License