U Miami total enrollment is approximately 17,809 students. 10,737 are undergraduates and 5,663 are graduate students.
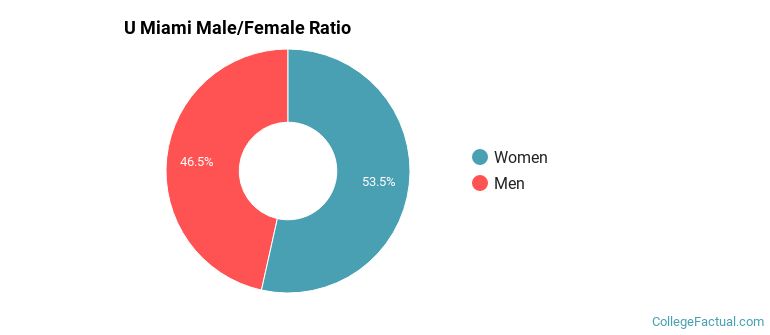
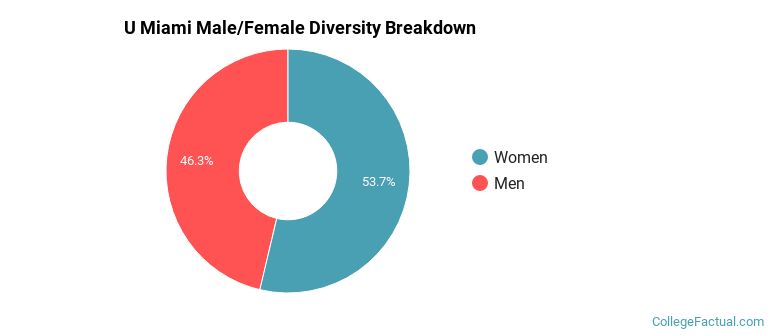
Male/Female Breakdown of Undergraduates
The full-time U Miami undergraduate population is made up of 53% women, and 47% men.
For the gender breakdown for all students, go here.
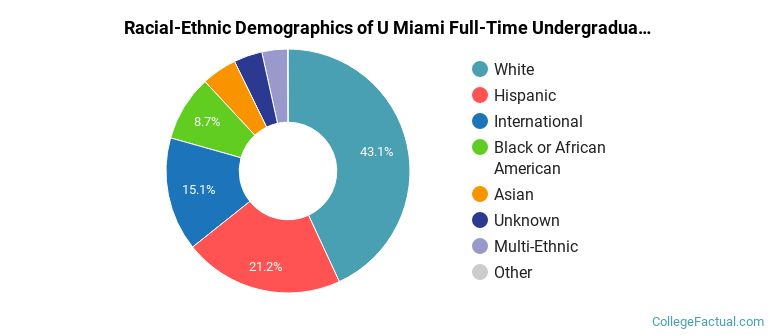
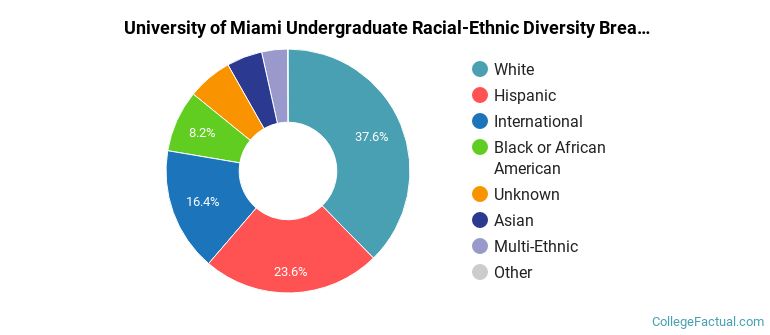
U Miami Racial/Ethnic Breakdown of Undergraduates
| Race/Ethnicity | Number |
|---|---|
| White | 4,644 |
| Hispanic | 2,432 |
| International | 1,374 |
| Black or African American | 1,016 |
| Asian | 507 |
| Multi-Ethnic | 380 |
| Unknown | 365 |
| Native Hawaiian or Pacific Islander | 6 |
See racial/ethnic breakdown for all students.
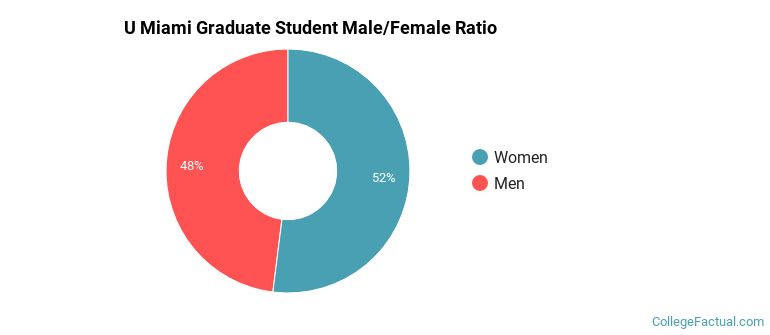
Male/Female Breakdown of Graduate Students
About 54% of full-time grad students are women, and 46% men.
For the gender breakdown for all students, go here.
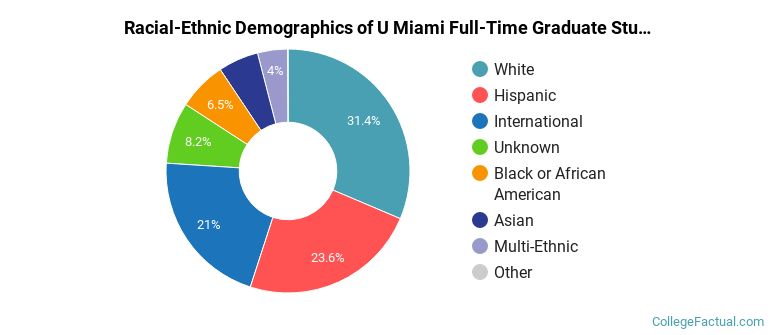
U Miami Racial-Ethnic Breakdown of Graduate Students
| Race/Ethnicity | Number |
|---|---|
| White | 1,946 |
| Hispanic | 1,477 |
| International | 888 |
| Black or African American | 412 |
| Unknown | 389 |
| Asian | 290 |
| Multi-Ethnic | 245 |
| Native Hawaiian or Pacific Islander | 6 |
See racial/ethnic breakdown for all students.
| Race/Ethnicity | Number |
|---|---|
| White | 6,902 |
| Hispanic | 4,488 |
| International | 2,369 |
| Black or African American | 1,560 |
| Unknown | 956 |
| Asian | 843 |
| Multi-Ethnic | 655 |
| Native Hawaiian or Pacific Islander | 12 |
There are approximately 9,610 female students and 8,199 male students at U Miami.
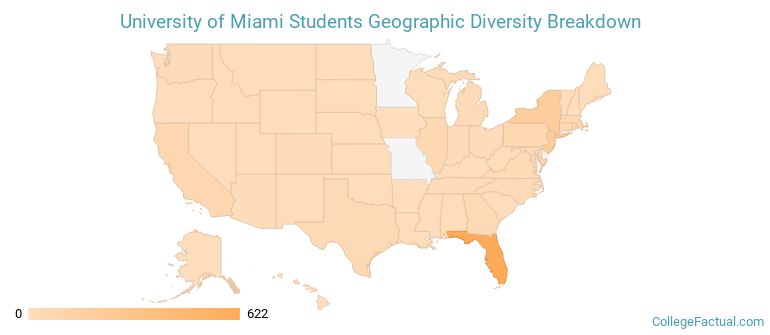
U Miami ranks 128 out of 2,183 when it comes to geographic diversity.
63.31% of U Miami students come from out of state, and 12.29% come from out of the country.
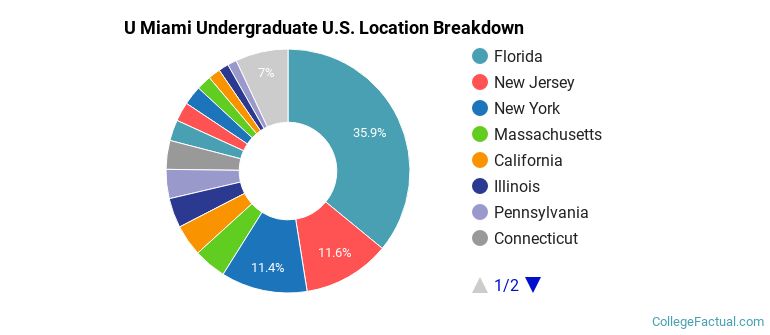
The undergraduate student body is split among 42 states (may include Washington D.C.). Click on the map for more detail.
| State | Amount |
|---|---|
| Florida | 622 |
| New Jersey | 200 |
| New York | 198 |
| Massachusetts | 75 |
| California | 72 |
Students from 125 countries are represented at this school, with the majority of the international students coming from China, Kuwait, and Venezuela.
Learn more about international students at U Miami.
A traditional college student is defined as being between the ages of 18-21. At U Miami, 52.19% of students fall into that category, compared to the national average of 60%.
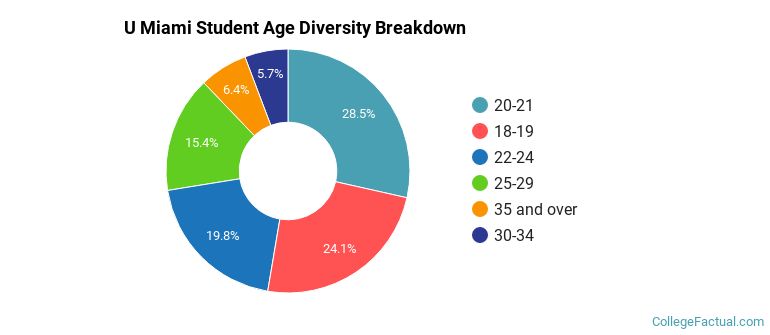
| Student Age Group | Amount |
|---|---|
| 20-21 | 4,806 |
| 18-19 | 4,068 |
| 22-24 | 3,334 |
| 25-29 | 2,599 |
| 35 and over | 1,076 |
| 30-34 | 968 |
| Under 18 | 0 |
Footnotes
*The racial-ethnic minorities count is calculated by taking the total number of students and subtracting white students, international students, and students whose race/ethnicity was unknown. This number is then divided by the total number of students at the school to obtain the racial-ethnic minorities percentage.
References
Department of Homeland Security Citizenship and Immigration Services
Image Credit: By Harrier233 under License
Find out how College Factual created their Diversity Rankings.