We've pulled together some essential information you should know about the program, including how many students graduate each year, the ethnic diversity of these students, average starting salaries, and more. We've also included details on how U-M ranks compared to other colleges offering a major in biochemistry.
Jump to any of the following sections:
In College Factual's most recent rankings for the best schools for biochemistry majors, U-M came in at #13. This puts it in the top 5% of the country in this field of study. It is also ranked #1 in Michigan.
During the 2021-2022 academic year, University of Michigan - Ann Arbor handed out 272 bachelor's degrees in biochemistry, biophysics & molecular biology. This is a decrease of 3% over the previous year when 280 degrees were handed out.
In 2022, 29 students received their master’s degree in biochemistry from U-M. This makes it the #5 most popular school for biochemistry master’s degree candidates in the country.
In addition, 35 students received their doctoral degrees in biochemistry in 2022, making the school the #2 most popular school in the United States for this category of students.
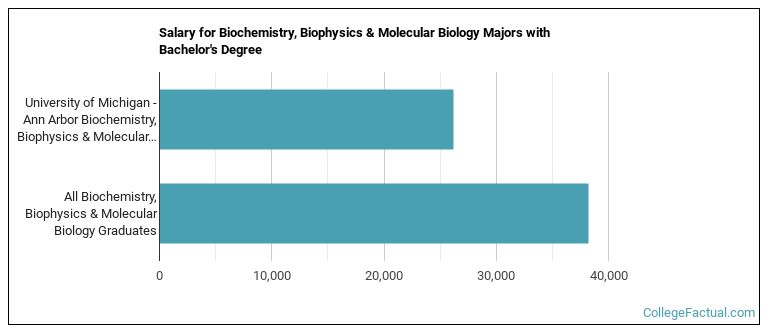
The median salary of biochemistry students who receive their bachelor's degree at U-M is $26,151. This is less than $38,243, which is the national median of all biochemistry majors in the nation who earn bachelor's degrees.
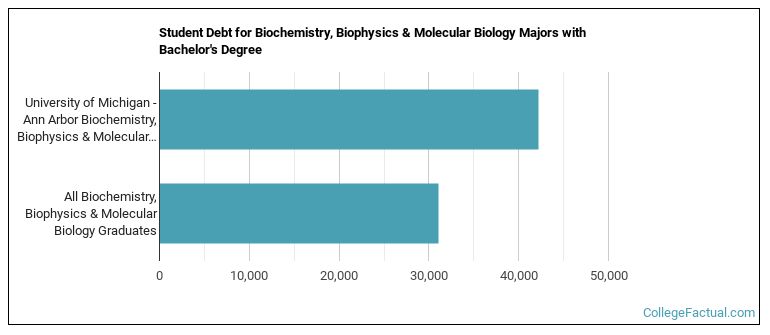
While getting their bachelor's degree at U-M, biochemistry students borrow a median amount of $42,232 in student loans. This is higher than the the typical median of $31,027 for all biochemistry majors across the country.
The typical student loan payment of a bachelor's degree student from the biochemistry program at U-M is $277 per month.
In 2022-2023, the average part-time undergraduate tuition at U-M was $2,458 per credit hour for out-of-state students. The average for in-state students was $716 per credit hour. The following table shows the average full-time tuition and fees for undergraduates.
| In State | Out of State | |
|---|---|---|
| Tuition | $17,977 | $59,775 |
| Fees | $332 | $332 |
| Books and Supplies | $1,126 | $1,126 |
| On Campus Room and Board | $13,856 | $13,856 |
| On Campus Other Expenses | $2,572 | $2,572 |
Learn more about U-M tuition and fees.
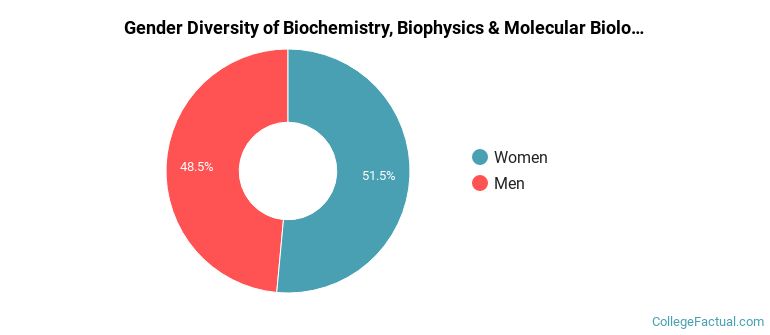
Of the 272 biochemistry students who graduated with a bachelor's degree in 2021-2022 from U-M, about 49% were men and 51% were women.
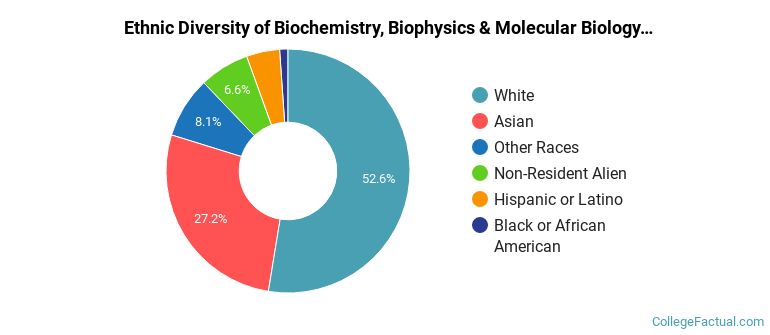
The majority of the students with this major are white. About 53% of 2022 graduates were in this category.
The following table and chart show the ethnic background for students who recently graduated from University of Michigan - Ann Arbor with a bachelor's in biochemistry.
| Ethnic Background | Number of Students |
|---|---|
| Asian | 74 |
| Black or African American | 3 |
| Hispanic or Latino | 12 |
| White | 143 |
| Non-Resident Aliens | 18 |
| Other Races | 22 |
Online degrees for the U-M biochemistry bachelor’s degree program are not available at this time. To see if the school offers distance learning options in other areas, visit the U-M Online Learning page.
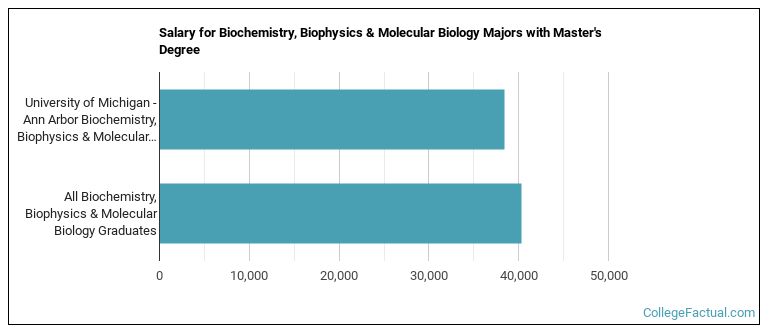
Graduates of the master's biochemistry program at U-M make a median salary of $38,471. This is less than what their typical peers from other schools make. Their median salary is $40,356.
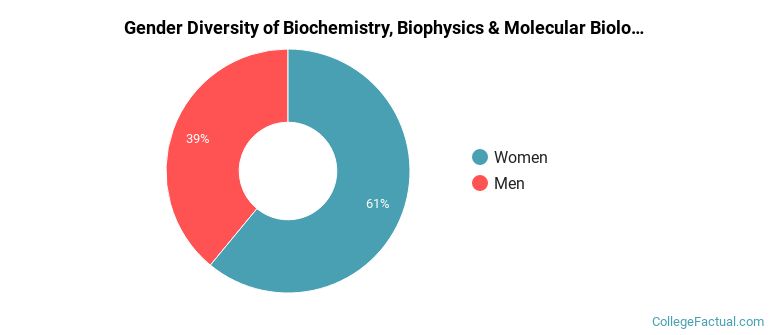
For the most recent academic year available, 39% of biochemistry master's degrees went to men and 61% went to women.
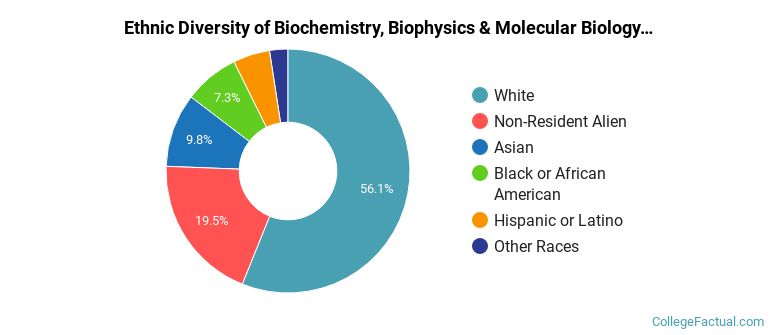
The majority of the students with this major are white. About 56% of 2022 graduates were in this category.
The following table and chart show the ethnic background for students who recently graduated from University of Michigan - Ann Arbor with a master's in biochemistry.
| Ethnic Background | Number of Students |
|---|---|
| Asian | 4 |
| Black or African American | 3 |
| Hispanic or Latino | 2 |
| White | 23 |
| Non-Resident Aliens | 8 |
| Other Races | 1 |
Take a look at the following statistics related to the make-up of the biochemistry majors at University of Michigan - Ann Arbor.
| Related Major | Annual Graduates |
|---|---|
| General Biology | 270 |
| Neurobiology & Neurosciences | 243 |
| Ecology, Evolution & Systematics Biology | 159 |
| Biomathematics & Bioinformatics | 90 |
| Microbiological Sciences & Immunology | 69 |
View All Biochemistry, Biophysics & Molecular Biology Related Majors >
More about our data sources and methodologies.