U-M total enrollment is approximately 47,907 students. 29,851 are undergraduates and 14,733 are graduate students.
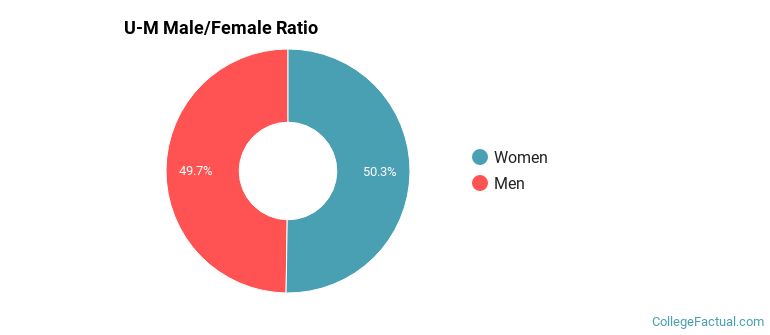
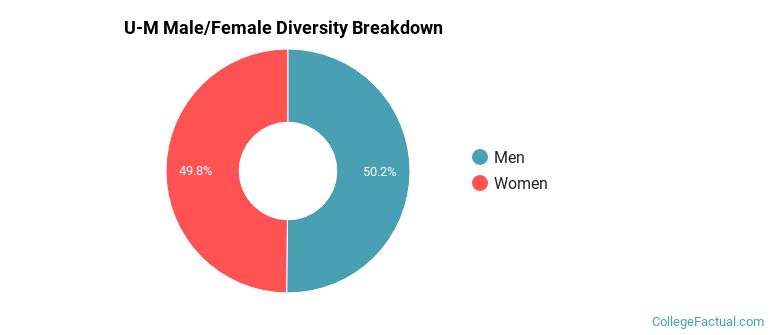
Male/Female Breakdown of Undergraduates
The full-time U-M undergraduate population is made up of 51% women, and 49% men.
For the gender breakdown for all students, go here.
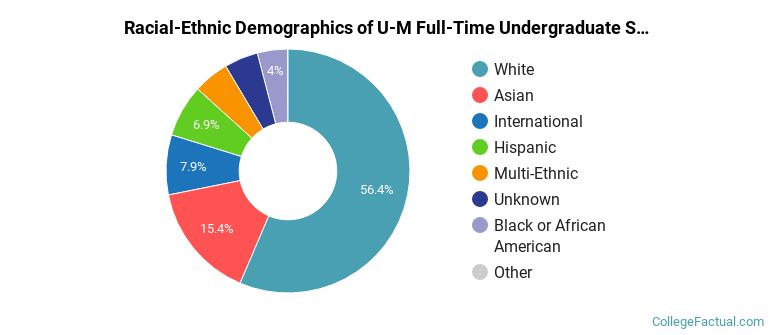
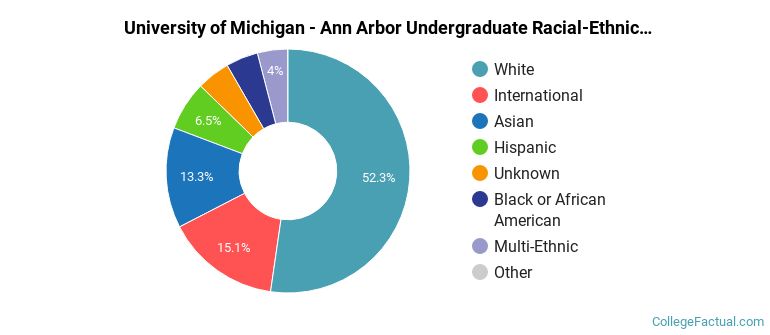
U-M Racial/Ethnic Breakdown of Undergraduates
| Race/Ethnicity | Number |
|---|---|
| White | 16,435 |
| Asian | 4,885 |
| International | 2,206 |
| Hispanic | 2,097 |
| Unknown | 1,521 |
| Multi-Ethnic | 1,445 |
| Black or African American | 1,216 |
| Native Hawaiian or Pacific Islander | 12 |
See racial/ethnic breakdown for all students.
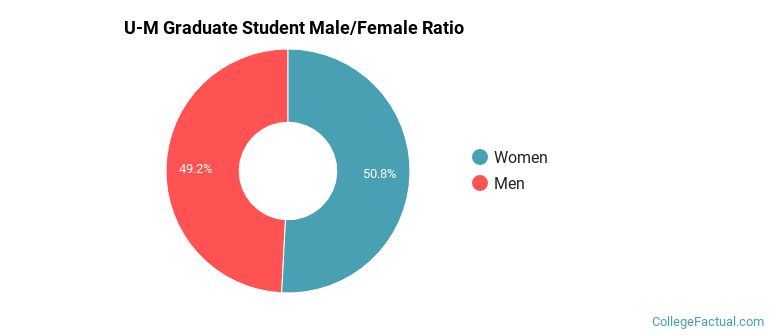
Male/Female Breakdown of Graduate Students
About 52% of full-time grad students are women, and 48% men.
For the gender breakdown for all students, go here.
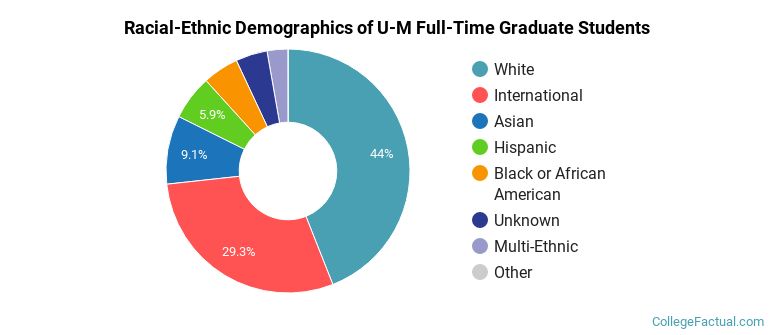
U-M Racial-Ethnic Breakdown of Graduate Students
| Race/Ethnicity | Number |
|---|---|
| White | 6,685 |
| International | 3,846 |
| Asian | 1,430 |
| Hispanic | 980 |
| Black or African American | 752 |
| Unknown | 511 |
| Multi-Ethnic | 482 |
| Native Hawaiian or Pacific Islander | 5 |
See racial/ethnic breakdown for all students.
| Race/Ethnicity | Number |
|---|---|
| White | 24,819 |
| Asian | 6,734 |
| International | 6,680 |
| Hispanic | 3,258 |
| Unknown | 2,207 |
| Black or African American | 2,079 |
| Multi-Ethnic | 2,028 |
| Native Hawaiian or Pacific Islander | 21 |
There are approximately 24,087 female students and 23,820 male students at U-M.
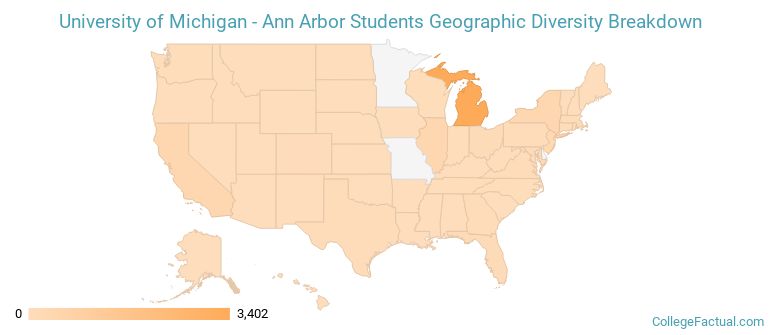
U-M ranks 186 out of 2,183 when it comes to geographic diversity.
46.34% of U-M students come from out of state, and 5.14% come from out of the country.
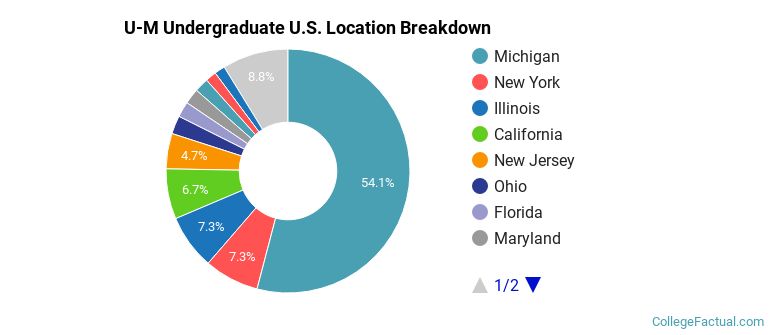
The undergraduate student body is split among 47 states (may include Washington D.C.). Click on the map for more detail.
| State | Amount |
|---|---|
| Michigan | 3,402 |
| Illinois | 457 |
| New York | 457 |
| California | 419 |
| New Jersey | 295 |
Students from 125 countries are represented at this school, with the majority of the international students coming from China, India, and South Korea.
Learn more about international students at U-M.
A traditional college student is defined as being between the ages of 18-21. At U-M, 57.91% of students fall into that category, compared to the national average of 60%.

| Student Age Group | Amount |
|---|---|
| 18-19 | 13,380 |
| 20-21 | 13,262 |
| 22-24 | 7,991 |
| 25-29 | 7,170 |
| 30-34 | 2,144 |
| 35 and over | 1,090 |
| Under 18 | 0 |
Footnotes
*The racial-ethnic minorities count is calculated by taking the total number of students and subtracting white students, international students, and students whose race/ethnicity was unknown. This number is then divided by the total number of students at the school to obtain the racial-ethnic minorities percentage.
References
Department of Homeland Security Citizenship and Immigration Services
Image Credit: By Dwight Burdette under License
Find out how College Factual created their Diversity Rankings.