UM Dearborn total enrollment is approximately 8,783 students. 5,012 are undergraduates and 417 are graduate students.
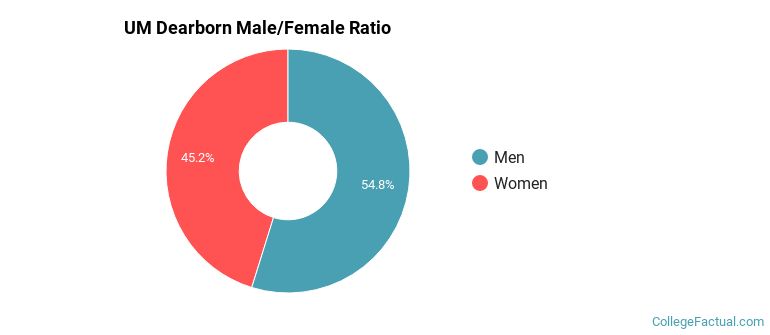
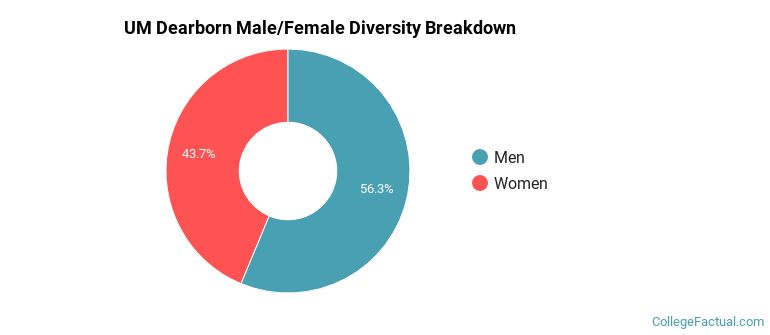
Male/Female Breakdown of Undergraduates
The full-time UM Dearborn undergraduate population is made up of 46% women, and 54% men.
For the gender breakdown for all students, go here.
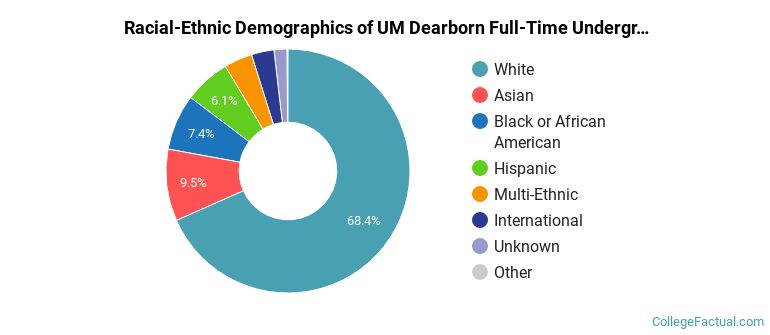
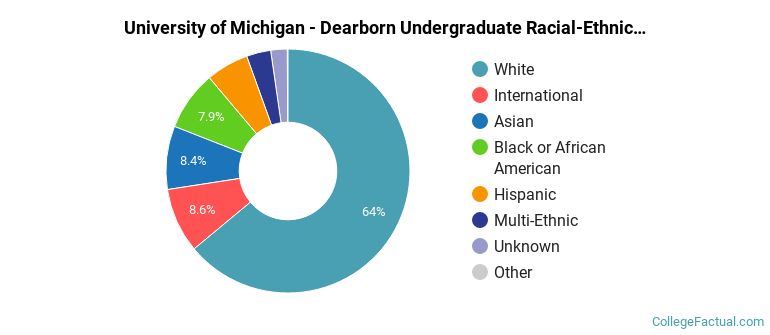
UM Dearborn Racial/Ethnic Breakdown of Undergraduates
| Race/Ethnicity | Number |
|---|---|
| White | 3,377 |
| Asian | 473 |
| Black or African American | 363 |
| Hispanic | 319 |
| Multi-Ethnic | 237 |
| International | 140 |
| Unknown | 92 |
| Native Hawaiian or Pacific Islander | 4 |
See racial/ethnic breakdown for all students.
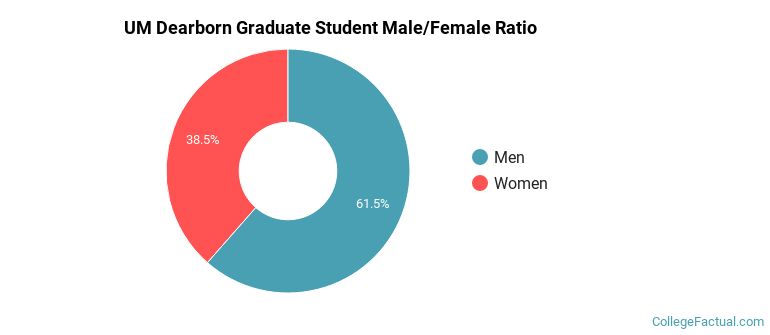
Male/Female Breakdown of Graduate Students
About 45% of full-time grad students are women, and 55% men.
For the gender breakdown for all students, go here.
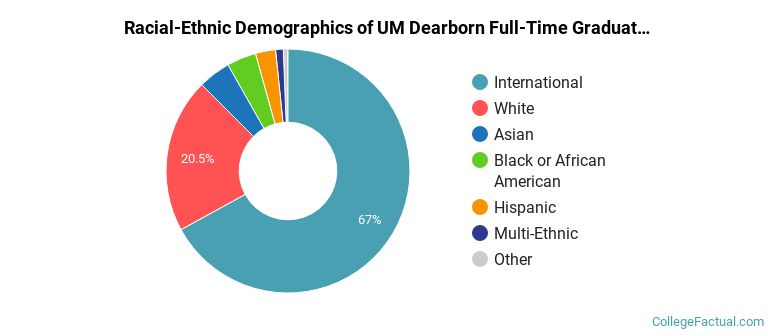
UM Dearborn Racial-Ethnic Breakdown of Graduate Students
| Race/Ethnicity | Number |
|---|---|
| International | 225 |
| White | 123 |
| Asian | 22 |
| Multi-Ethnic | 15 |
| Black or African American | 14 |
| Hispanic | 9 |
| Unknown | 7 |
| Native Hawaiian or Pacific Islander | 0 |
See racial/ethnic breakdown for all students.
| Race/Ethnicity | Number |
|---|---|
| White | 5,627 |
| Asian | 772 |
| Black or African American | 678 |
| International | 635 |
| Hispanic | 525 |
| Multi-Ethnic | 348 |
| Unknown | 170 |
| Native Hawaiian or Pacific Islander | 7 |
There are approximately 3,876 female students and 4,907 male students at UM Dearborn.
UM Dearborn ranks 1,869 out of 2,183 when it comes to geographic diversity.
0.76% of UM Dearborn students come from out of state, and 2.33% come from out of the country.
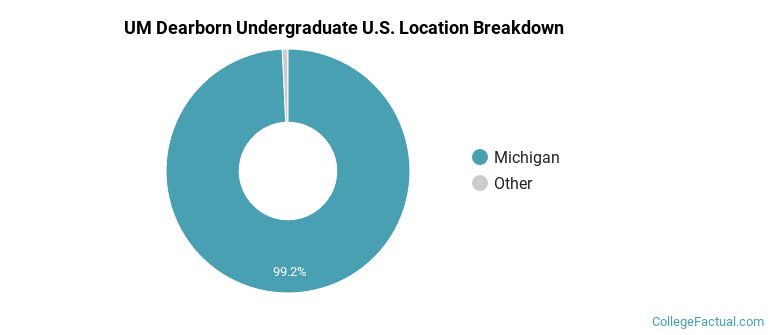
The undergraduate student body is split among 6 states (may include Washington D.C.). Click on the map for more detail.
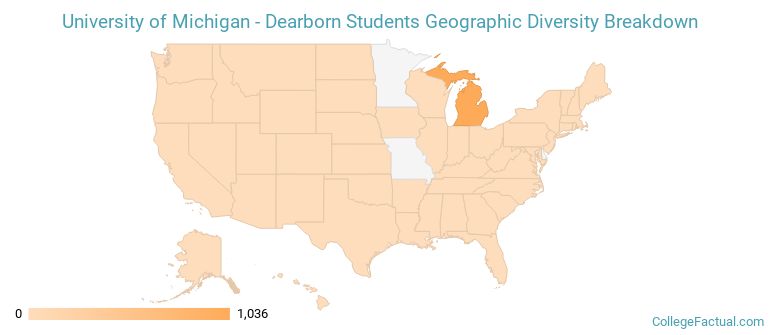
| State | Amount |
|---|---|
| Michigan | 1,036 |
| California | 3 |
| Massachusetts | 2 |
| Illinois | 1 |
| Mississippi | 1 |
Students from 46 countries are represented at this school, with the majority of the international students coming from India, China, and Oman.
Learn more about international students at UM Dearborn.
A traditional college student is defined as being between the ages of 18-21. At UM Dearborn, 41.95% of students fall into that category, compared to the national average of 60%.
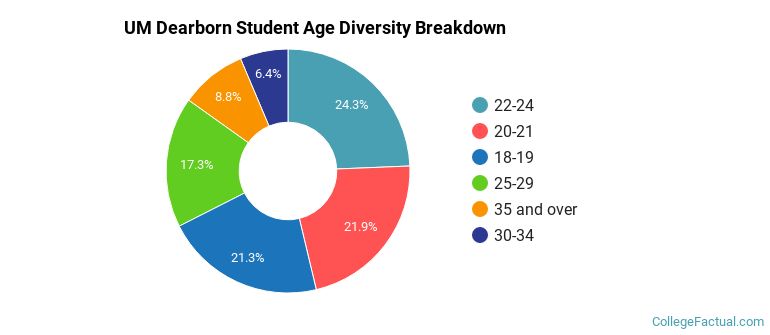
| Student Age Group | Amount |
|---|---|
| 22-24 | 2,207 |
| 20-21 | 1,987 |
| 18-19 | 1,927 |
| 25-29 | 1,570 |
| 35 and over | 796 |
| 30-34 | 577 |
| Under 18 | 0 |
Footnotes
*The racial-ethnic minorities count is calculated by taking the total number of students and subtracting white students, international students, and students whose race/ethnicity was unknown. This number is then divided by the total number of students at the school to obtain the racial-ethnic minorities percentage.
References
Department of Homeland Security Citizenship and Immigration Services
Image Credit: By Dave Parker under License