We've gathered data and other essential information about the program, such as the average salary of graduates, ethnicity of students, how many students graduated in recent times, and more. In addition, we cover how Ole Miss ranks in comparison to other schools with subject specific ed programs.
Go directly to any of the following sections:
The bachelor's program at Ole Miss was ranked #147 on College Factual's Best Schools for subject specific ed list. It is also ranked #1 in Mississippi.
| Ranking Type | Rank |
|---|---|
| Best Teacher Education Subject Specific Schools | 147 |
| Best Teacher Education Subject Specific Bachelor’s Degree Schools | 148 |
During the 2021-2022 academic year, University of Mississippi handed out 53 bachelor's degrees in teacher education subject specific. This is an increase of 6% over the previous year when 50 degrees were handed out.
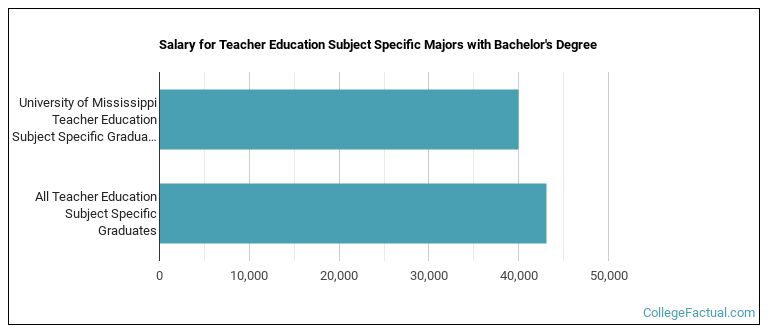
The median salary of subject specific ed students who receive their bachelor's degree at Ole Miss is $39,985. Unfortunately, this is lower than the national average of $43,086 for all subject specific ed students.
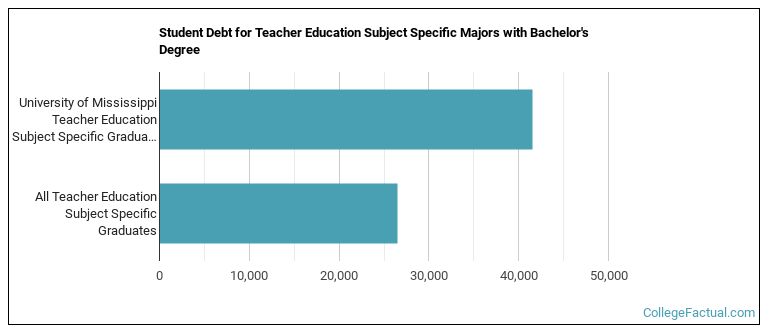
While getting their bachelor's degree at Ole Miss, subject specific ed students borrow a median amount of $41,550 in student loans. This is higher than the the typical median of $26,530 for all subject specific ed majors across the country.
In 2022-2023, the average part-time undergraduate tuition at Ole Miss was $1,118 per credit hour for out-of-state students. The average for in-state students was $386 per credit hour. The following table shows the average full-time tuition and fees for undergraduates.
| In State | Out of State | |
|---|---|---|
| Tuition | $9,252 | $26,820 |
| Fees | $160 | $160 |
| Books and Supplies | $1,200 | $1,200 |
| On Campus Room and Board | $12,040 | $12,040 |
| On Campus Other Expenses | $6,300 | $6,300 |
Learn more about Ole Miss tuition and fees.
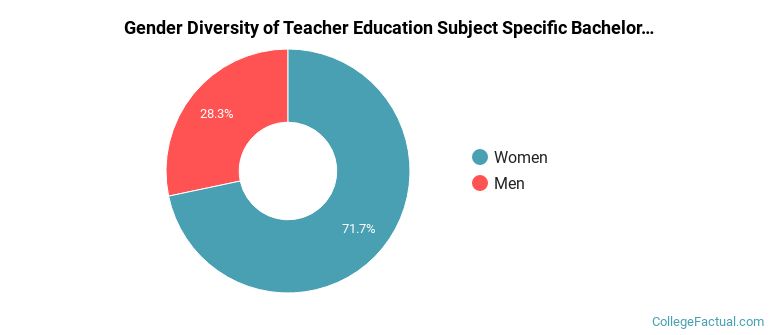
In the 2021-2022 academic year, 53 students earned a bachelor's degree in subject specific ed from Ole Miss. About 72% of these graduates were women and the other 28% were men.
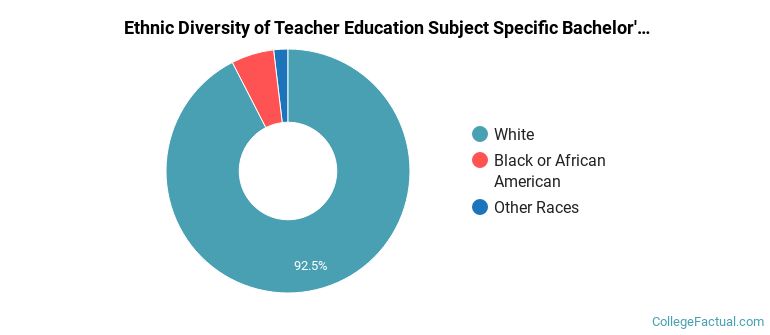
The majority of the students with this major are white. About 92% of 2022 graduates were in this category.
The following table and chart show the ethnic background for students who recently graduated from University of Mississippi with a bachelor's in subject specific ed.
| Ethnic Background | Number of Students |
|---|---|
| Asian | 0 |
| Black or African American | 3 |
| Hispanic or Latino | 0 |
| White | 49 |
| Non-Resident Aliens | 0 |
| Other Races | 1 |
Online degrees for the Ole Miss subject specific ed bachelor’s degree program are not available at this time. To see if the school offers distance learning options in other areas, visit the Ole Miss Online Learning page.
Take a look at the following statistics related to the make-up of the subject specific ed majors at University of Mississippi.
| Related Major | Annual Graduates |
|---|---|
| Teacher Education Grade Specific | 177 |
| Curriculum & Instruction | 96 |
| Educational Administration | 93 |
| Student Counseling | 31 |
| General Education | 23 |
View All Teacher Education Subject Specific Related Majors >
More about our data sources and methodologies.