Ole Miss total enrollment is approximately 21,014 students. 14,839 are undergraduates and 3,384 are graduate students.
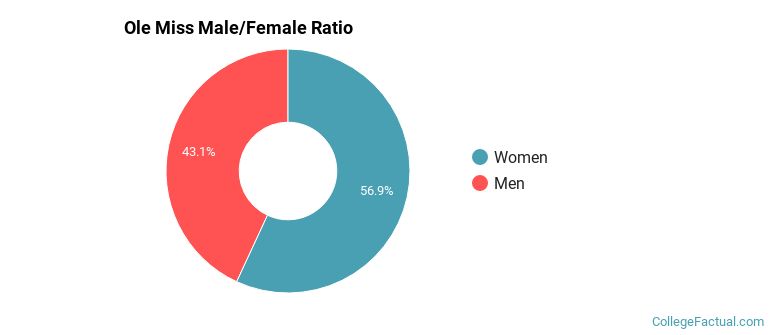
Male/Female Breakdown of Undergraduates
The full-time Ole Miss undergraduate population is made up of 59% women, and 41% men.
For the gender breakdown for all students, go here.
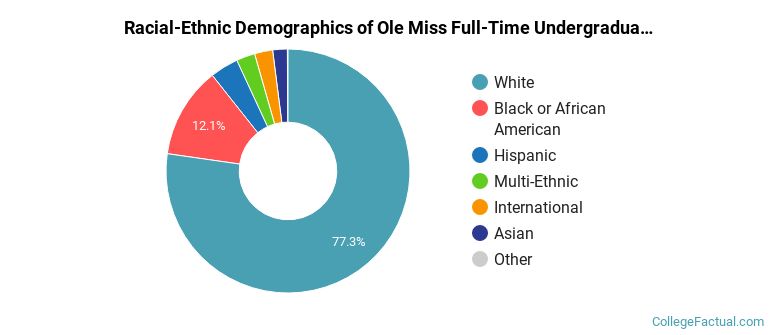
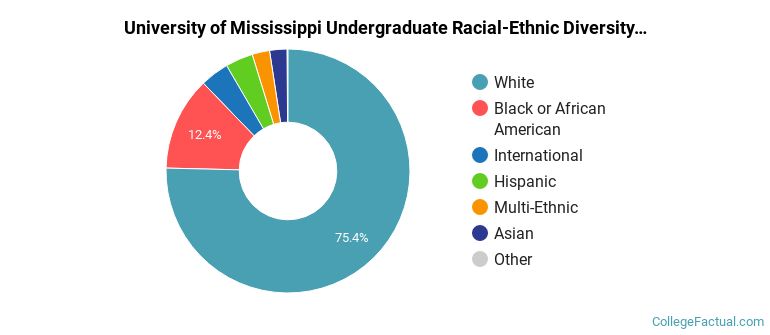
Ole Miss Racial/Ethnic Breakdown of Undergraduates
| Race/Ethnicity | Number |
|---|---|
| White | 11,477 |
| Black or African American | 1,814 |
| Hispanic | 599 |
| Multi-Ethnic | 349 |
| Asian | 315 |
| International | 206 |
| Unknown | 31 |
| Native Hawaiian or Pacific Islander | 10 |
See racial/ethnic breakdown for all students.
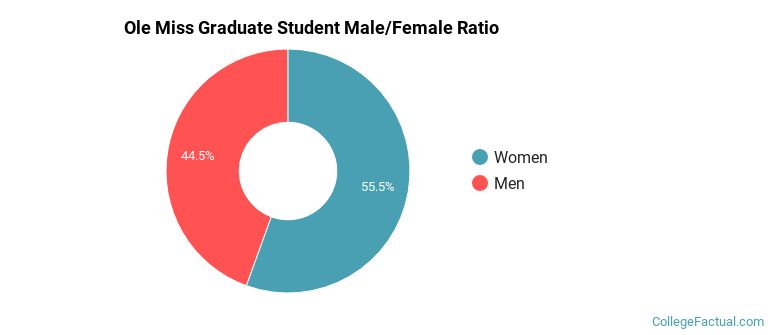
Male/Female Breakdown of Graduate Students
About 57% of full-time grad students are women, and 43% men.
For the gender breakdown for all students, go here.
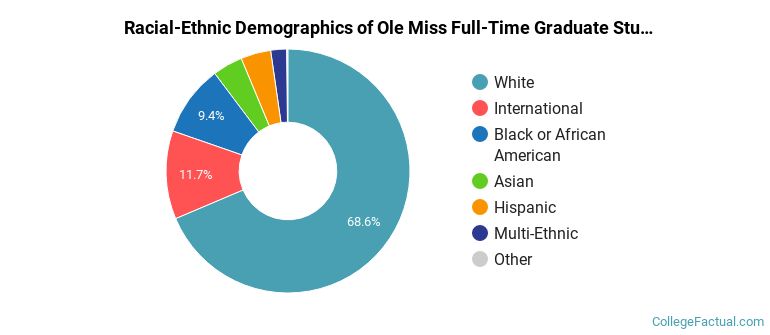
Ole Miss Racial-Ethnic Breakdown of Graduate Students
| Race/Ethnicity | Number |
|---|---|
| White | 2,312 |
| Black or African American | 378 |
| International | 364 |
| Asian | 129 |
| Hispanic | 102 |
| Multi-Ethnic | 81 |
| Unknown | 9 |
| Native Hawaiian or Pacific Islander | 2 |
See racial/ethnic breakdown for all students.
| Race/Ethnicity | Number |
|---|---|
| White | 15,734 |
| Black or African American | 2,686 |
| Hispanic | 793 |
| International | 669 |
| Asian | 521 |
| Multi-Ethnic | 481 |
| Unknown | 60 |
| Native Hawaiian or Pacific Islander | 13 |

There are approximately 12,292 female students and 8,722 male students at Ole Miss.
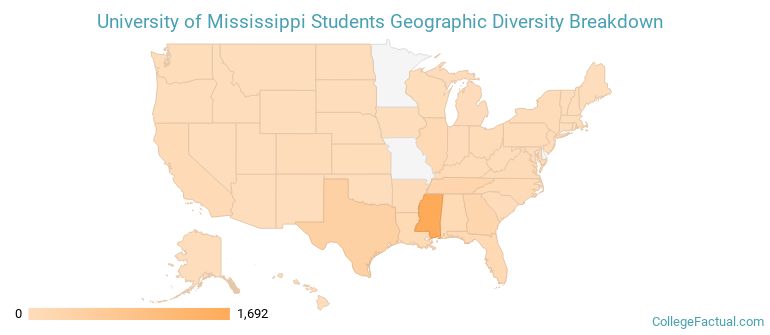
Ole Miss ranks 210 out of 2,183 when it comes to geographic diversity.
56.85% of Ole Miss students come from out of state, and 1.03% come from out of the country.
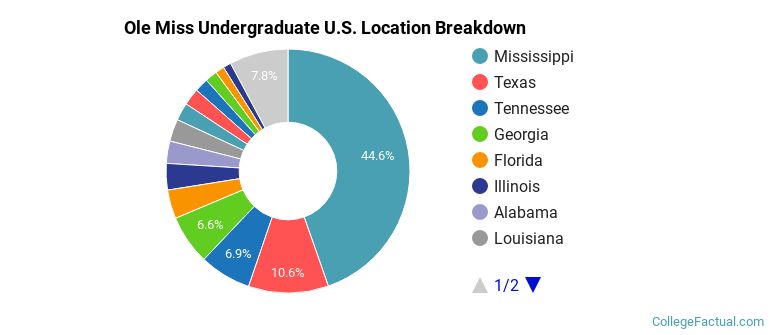
The undergraduate student body is split among 44 states (may include Washington D.C.). Click on the map for more detail.
| State | Amount |
|---|---|
| Mississippi | 1,692 |
| Texas | 402 |
| Tennessee | 260 |
| Georgia | 249 |
| Florida | 145 |
Students from 79 countries are represented at this school, with the majority of the international students coming from India, China, and Nepal.
Learn more about international students at Ole Miss.
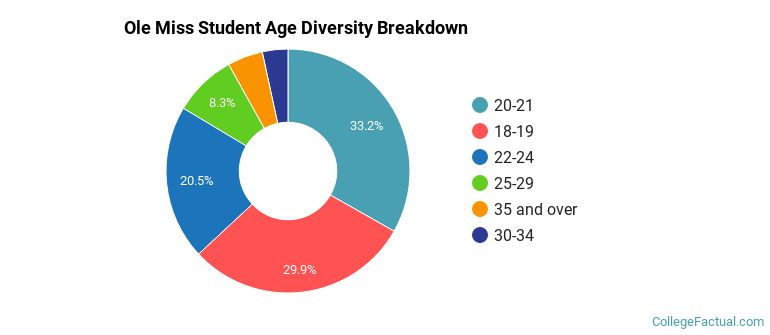
A traditional college student is defined as being between the ages of 18-21. At Ole Miss, 62.54% of students fall into that category, compared to the national average of 60%.
| Student Age Group | Amount |
|---|---|
| 20-21 | 7,619 |
| 18-19 | 6,850 |
| 22-24 | 4,705 |
| 25-29 | 1,909 |
| 35 and over | 1,077 |
| 30-34 | 779 |
| Under 18 | 0 |
Footnotes
*The racial-ethnic minorities count is calculated by taking the total number of students and subtracting white students, international students, and students whose race/ethnicity was unknown. This number is then divided by the total number of students at the school to obtain the racial-ethnic minorities percentage.
References
Department of Homeland Security Citizenship and Immigration Services
Image Credit: By Dudemanfellabra under License