UMKC total enrollment is approximately 16,147 students. 6,071 are undergraduates and 2,868 are graduate students.
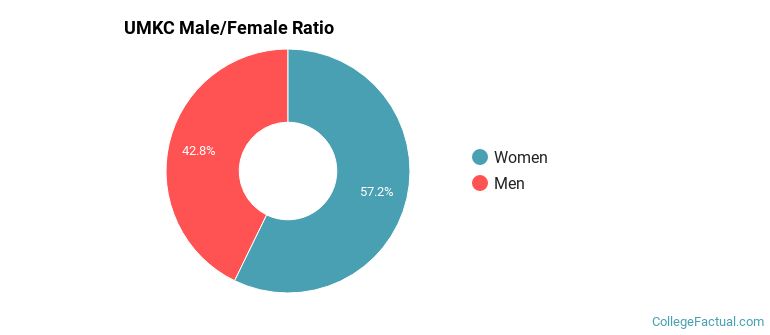
Male/Female Breakdown of Undergraduates
The full-time UMKC undergraduate population is made up of 59% women, and 41% men.
For the gender breakdown for all students, go here.
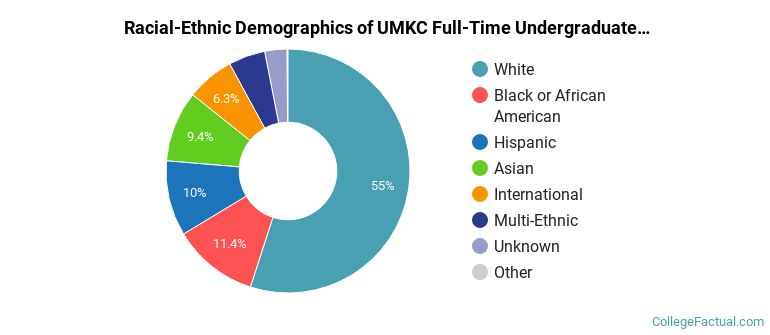
UMKC Racial/Ethnic Breakdown of Undergraduates
| Race/Ethnicity | Number |
|---|---|
| White | 3,258 |
| Black or African American | 767 |
| Hispanic | 636 |
| Asian | 591 |
| International | 319 |
| Multi-Ethnic | 310 |
| Unknown | 168 |
| Native Hawaiian or Pacific Islander | 7 |
See racial/ethnic breakdown for all students.
Male/Female Breakdown of Graduate Students
About 56% of full-time grad students are women, and 44% men.

For the gender breakdown for all students, go here.
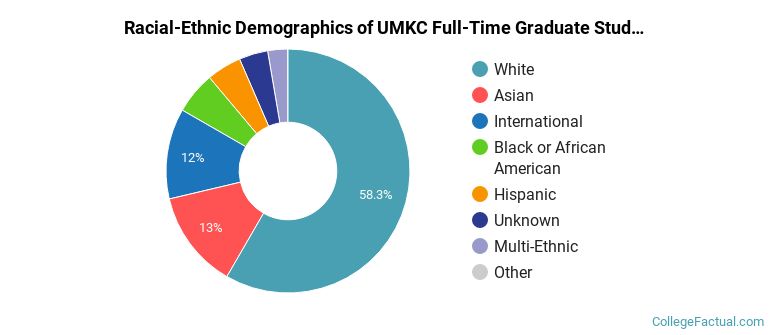
UMKC Racial-Ethnic Breakdown of Graduate Students
| Race/Ethnicity | Number |
|---|---|
| White | 1,715 |
| Asian | 372 |
| International | 292 |
| Black or African American | 165 |
| Hispanic | 142 |
| Unknown | 87 |
| Multi-Ethnic | 84 |
| Native Hawaiian or Pacific Islander | 2 |
See racial/ethnic breakdown for all students.
| Race/Ethnicity | Number |
|---|---|
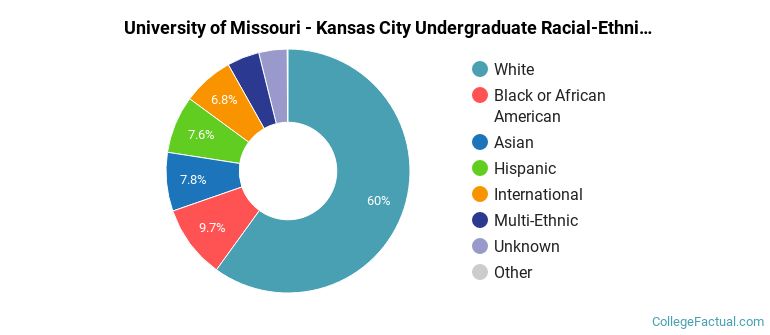
| White | 9,747 |
| Black or African American | 1,628 |
| Hispanic | 1,336 |
| Asian | 1,312 |
| International | 915 |
| Multi-Ethnic | 736 |
| Unknown | 411 |
| Native Hawaiian or Pacific Islander | 17 |
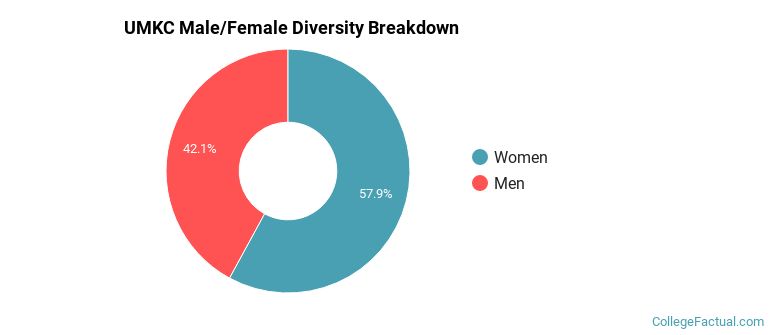
There are approximately 9,427 female students and 6,720 male students at UMKC.
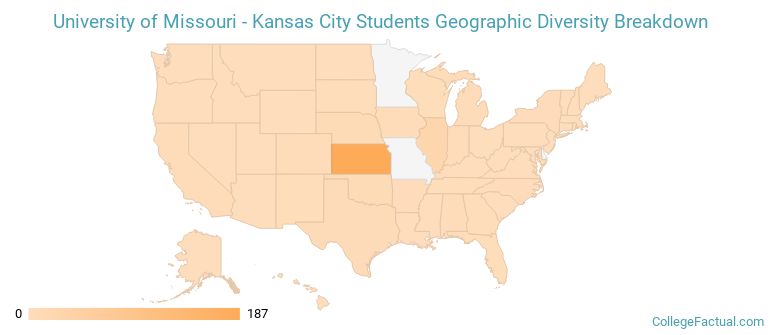
UMKC ranks 1,017 out of 2,183 when it comes to geographic diversity.
23.8% of UMKC students come from out of state, and 3.96% come from out of the country.
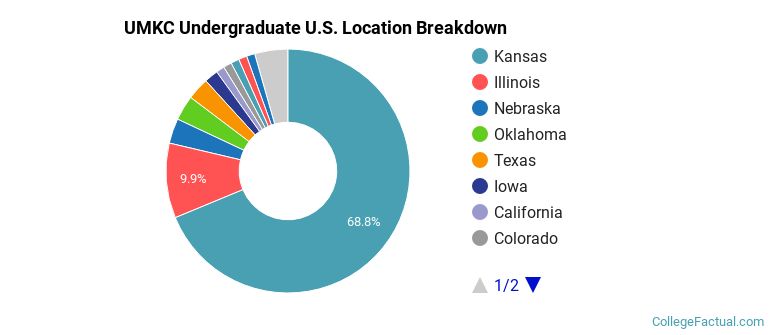
The undergraduate student body is split among 20 states (may include Washington D.C.). Click on the map for more detail.
| State | Amount |
|---|---|
| Kansas | 187 |
| Illinois | 27 |
| Nebraska | 9 |
| Oklahoma | 9 |
| Texas | 8 |
Students from 93 countries are represented at this school, with the majority of the international students coming from India, Saudi Arabia, and China.
Learn more about international students at UMKC.
A traditional college student is defined as being between the ages of 18-21. At UMKC, 30.73% of students fall into that category, compared to the national average of 60%.
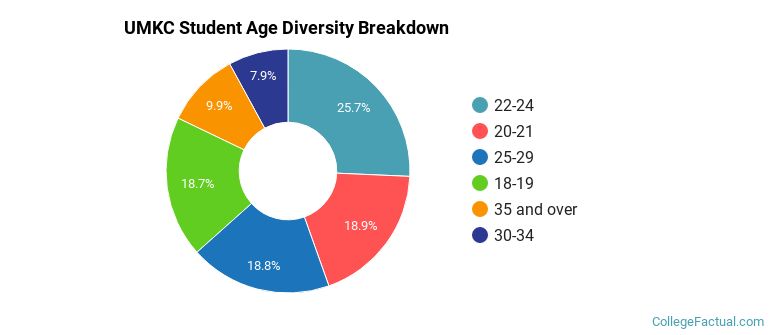
| Student Age Group | Amount |
|---|---|
| 22-24 | 3,441 |
| 20-21 | 2,524 |
| 25-29 | 2,523 |
| 18-19 | 2,507 |
| 35 and over | 1,329 |
| 30-34 | 1,063 |
| Under 18 | 0 |
Footnotes
*The racial-ethnic minorities count is calculated by taking the total number of students and subtracting white students, international students, and students whose race/ethnicity was unknown. This number is then divided by the total number of students at the school to obtain the racial-ethnic minorities percentage.
References
Department of Homeland Security Citizenship and Immigration Services
Read College Factual's Diversity Ranking Methodology.