UNK total enrollment is approximately 6,225 students. 3,795 are undergraduates and 298 are graduate students.
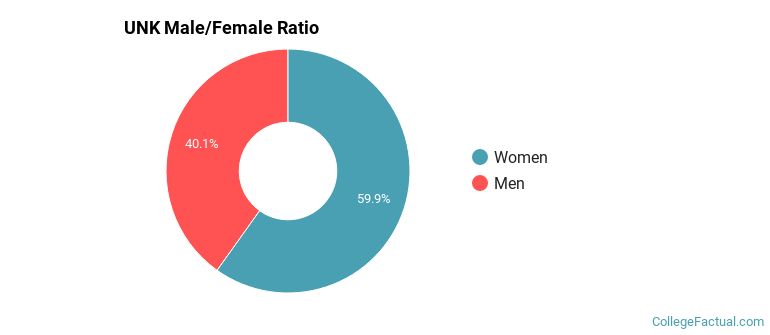
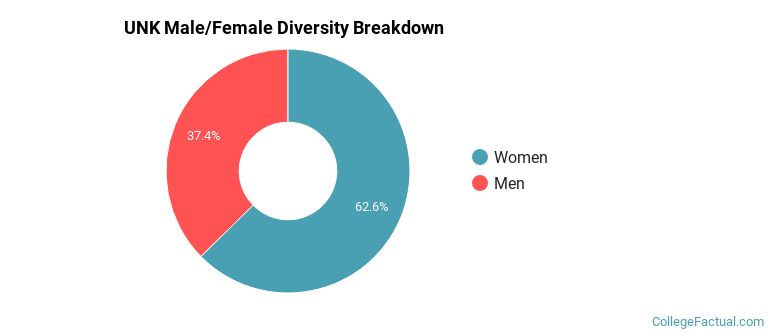
Male/Female Breakdown of Undergraduates
The full-time UNK undergraduate population is made up of 60% women, and 40% men.
For the gender breakdown for all students, go here.
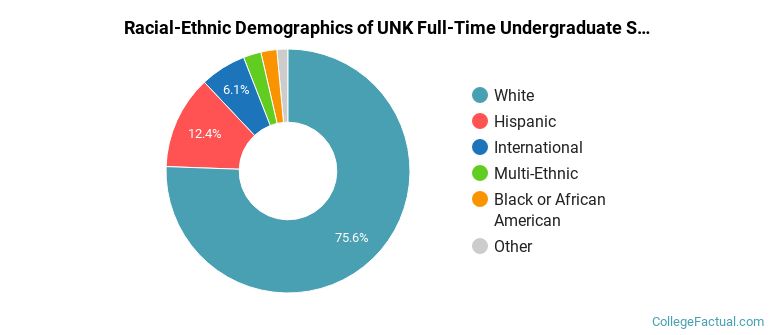
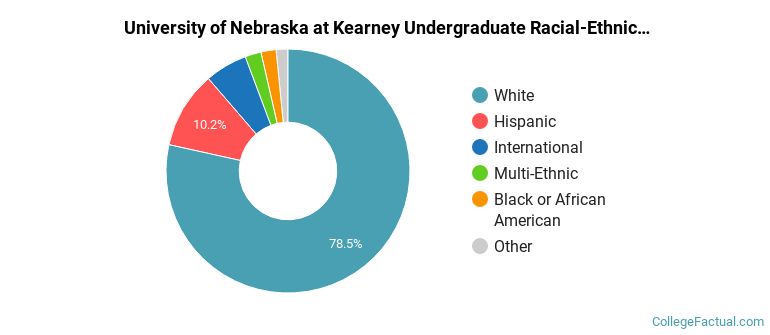
UNK Racial/Ethnic Breakdown of Undergraduates
| Race/Ethnicity | Number |
|---|---|
| White | 2,892 |
| Hispanic | 468 |
| International | 183 |
| Multi-Ethnic | 93 |
| Black or African American | 91 |
| Asian | 36 |
| Unknown | 23 |
| Native Hawaiian or Pacific Islander | 5 |
See racial/ethnic breakdown for all students.
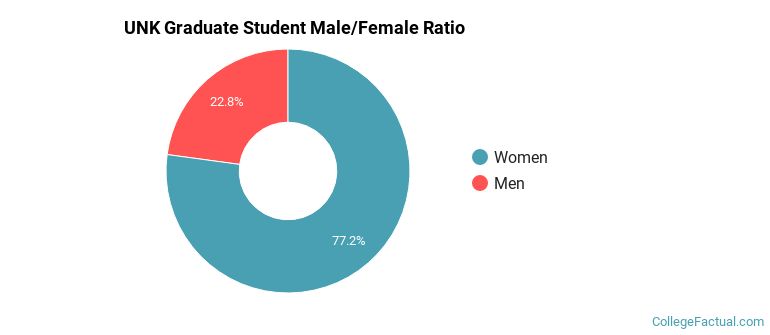
Male/Female Breakdown of Graduate Students
About 82% of full-time grad students are women, and 18% men.
For the gender breakdown for all students, go here.
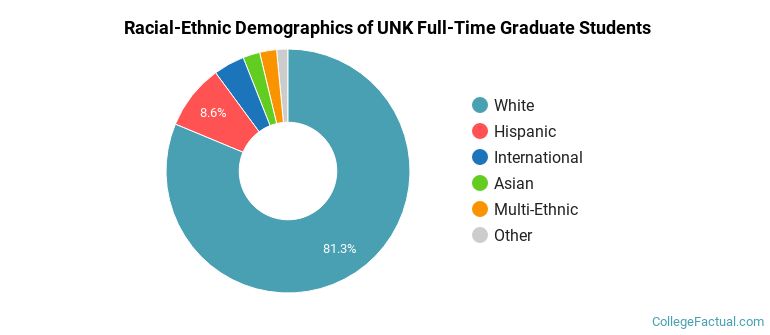
UNK Racial-Ethnic Breakdown of Graduate Students
| Race/Ethnicity | Number |
|---|---|
| White | 249 |
| Hispanic | 22 |
| Multi-Ethnic | 8 |
| Black or African American | 6 |
| International | 6 |
| Asian | 5 |
| Unknown | 2 |
| Native Hawaiian or Pacific Islander | 0 |
See racial/ethnic breakdown for all students.
| Race/Ethnicity | Number |
|---|---|
| White | 4,908 |
| Hispanic | 650 |
| International | 253 |
| Multi-Ethnic | 153 |
| Black or African American | 136 |
| Asian | 63 |
| Unknown | 47 |
| Native Hawaiian or Pacific Islander | 7 |
There are approximately 3,976 female students and 2,249 male students at UNK.
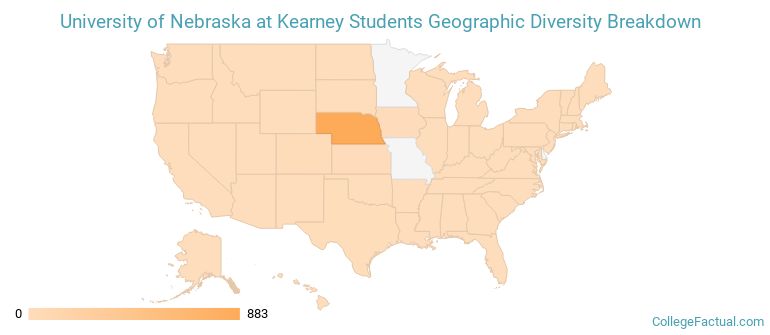
UNK ranks 1,279 out of 2,183 when it comes to geographic diversity.
8.59% of UNK students come from out of state, and 4.17% come from out of the country.
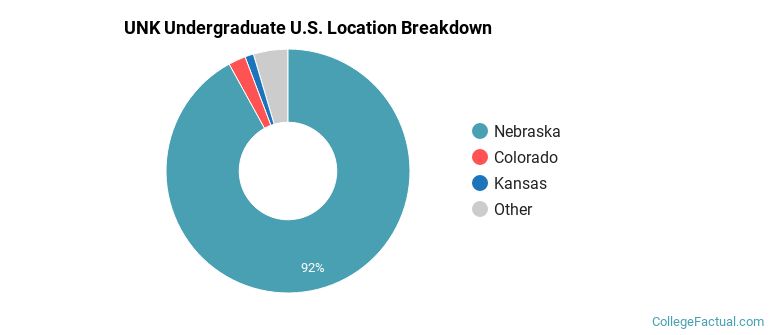
The undergraduate student body is split among 22 states (may include Washington D.C.). Click on the map for more detail.
| State | Amount |
|---|---|
| Nebraska | 883 |
| Colorado | 22 |
| Kansas | 11 |
| Iowa | 9 |
| Texas | 7 |
Students from 31 countries are represented at this school, with the majority of the international students coming from Japan, China, and Oman.
Learn more about international students at UNK.
A traditional college student is defined as being between the ages of 18-21. At UNK, 48.71% of students fall into that category, compared to the national average of 60%.
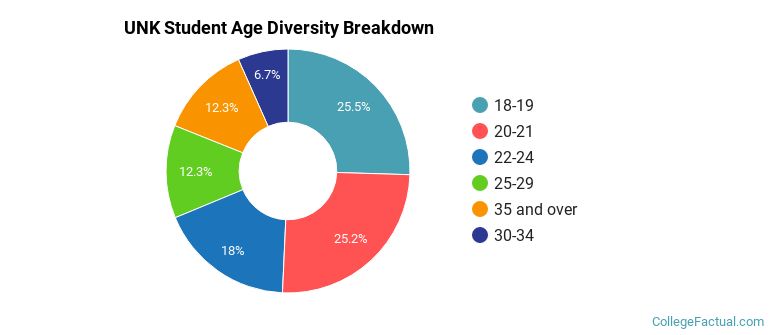
| Student Age Group | Amount |
|---|---|
| 18-19 | 1,626 |
| 20-21 | 1,610 |
| 22-24 | 1,150 |
| 25-29 | 786 |
| 35 and over | 783 |
| 30-34 | 425 |
| Under 18 | 0 |
Footnotes
*The racial-ethnic minorities count is calculated by taking the total number of students and subtracting white students, international students, and students whose race/ethnicity was unknown. This number is then divided by the total number of students at the school to obtain the racial-ethnic minorities percentage.
References
Department of Homeland Security Citizenship and Immigration Services
Image Credit: By Ammodramus under License