UNOMAHA total enrollment is approximately 15,892 students. 10,362 are undergraduates and 1,010 are graduate students.
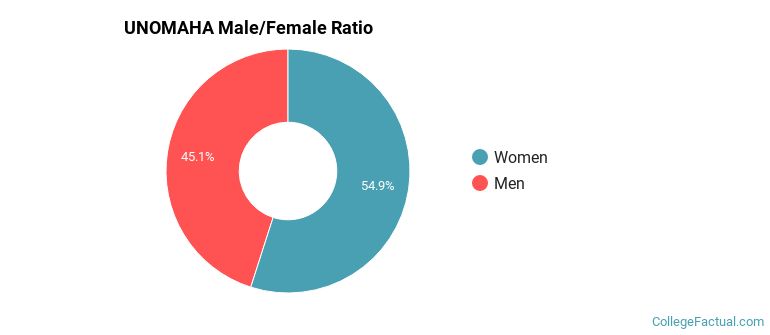
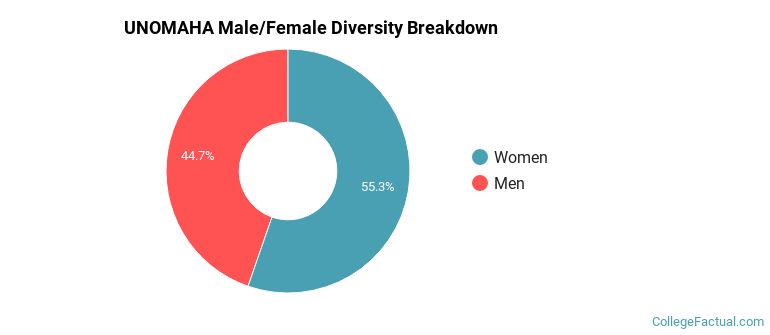
Male/Female Breakdown of Undergraduates
The full-time UNOMAHA undergraduate population is made up of 57% women, and 43% men.
For the gender breakdown for all students, go here.
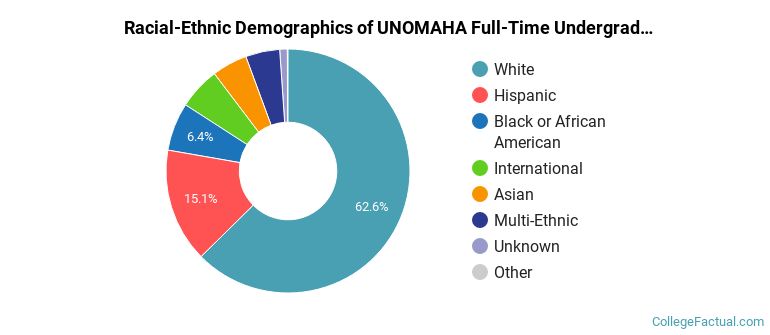
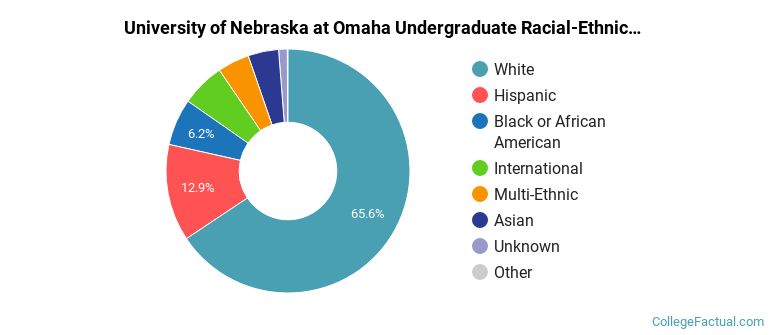
UNOMAHA Racial/Ethnic Breakdown of Undergraduates
| Race/Ethnicity | Number |
|---|---|
| White | 6,356 |
| Hispanic | 1,720 |
| Black or African American | 705 |
| Multi-Ethnic | 496 |
| Asian | 480 |
| International | 474 |
| Unknown | 91 |
| Native Hawaiian or Pacific Islander | 12 |
See racial/ethnic breakdown for all students.
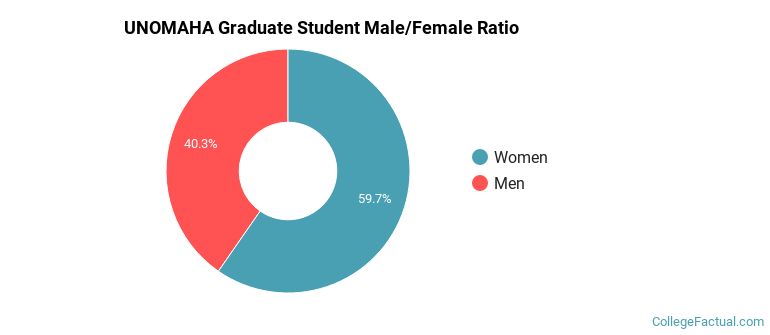
Male/Female Breakdown of Graduate Students
About 63% of full-time grad students are women, and 37% men.
For the gender breakdown for all students, go here.
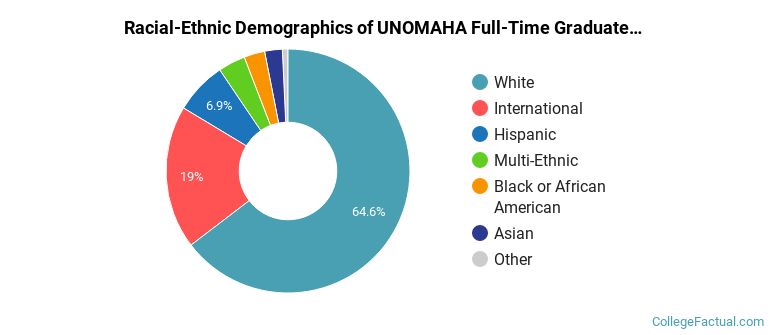
UNOMAHA Racial-Ethnic Breakdown of Graduate Students
| Race/Ethnicity | Number |
|---|---|
| White | 661 |
| International | 163 |
| Hispanic | 75 |
| Black or African American | 43 |
| Multi-Ethnic | 33 |
| Asian | 23 |
| Unknown | 10 |
| Native Hawaiian or Pacific Islander | 0 |
See racial/ethnic breakdown for all students.
| Race/Ethnicity | Number |
|---|---|
| White | 10,241 |
| Hispanic | 2,236 |
| Black or African American | 1,038 |
| International | 795 |
| Multi-Ethnic | 703 |
| Asian | 650 |
| Unknown | 168 |
| Native Hawaiian or Pacific Islander | 24 |
There are approximately 8,979 female students and 6,913 male students at UNOMAHA.
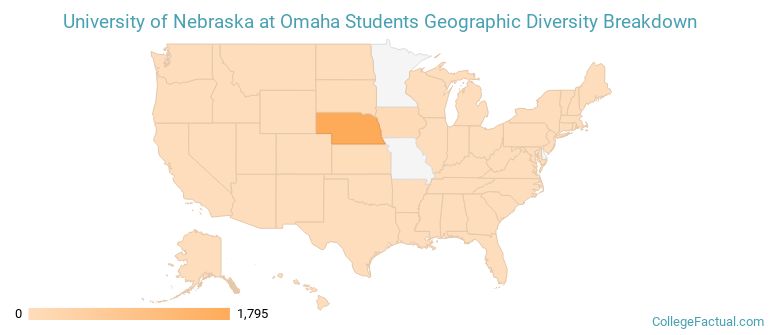
UNOMAHA ranks 1,322 out of 2,183 when it comes to geographic diversity.
9.8% of UNOMAHA students come from out of state, and 3.54% come from out of the country.
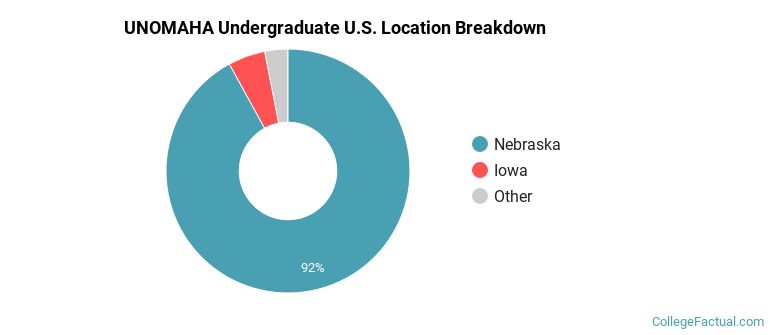
The undergraduate student body is split among 20 states (may include Washington D.C.). Click on the map for more detail.
| State | Amount |
|---|---|
| Nebraska | 1,795 |
| Iowa | 96 |
| Kansas | 13 |
| South Dakota | 11 |
| Illinois | 8 |
Students from 78 countries are represented at this school, with the majority of the international students coming from India, China, and Oman.
Learn more about international students at UNOMAHA.
A traditional college student is defined as being between the ages of 18-21. At UNOMAHA, 46.42% of students fall into that category, compared to the national average of 60%.
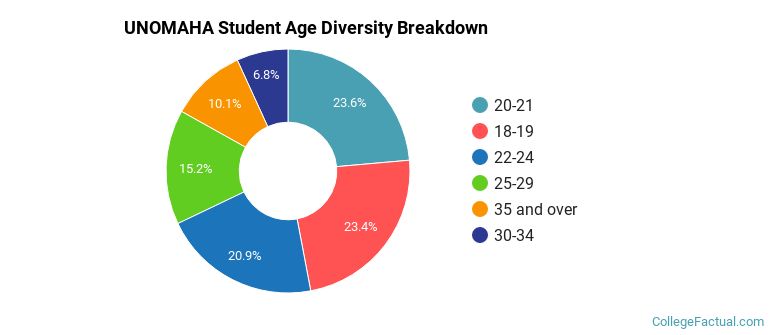
| Student Age Group | Amount |
|---|---|
| 20-21 | 3,664 |
| 18-19 | 3,639 |
| 22-24 | 3,246 |
| 25-29 | 2,363 |
| 35 and over | 1,562 |
| 30-34 | 1,060 |
| Under 18 | 0 |
Footnotes
*The racial-ethnic minorities count is calculated by taking the total number of students and subtracting white students, international students, and students whose race/ethnicity was unknown. This number is then divided by the total number of students at the school to obtain the racial-ethnic minorities percentage.
References
Department of Homeland Security Citizenship and Immigration Services
Image Credit: By Beatmastermatt under License