UNL total enrollment is approximately 25,108 students. 18,949 are undergraduates and 2,585 are graduate students.
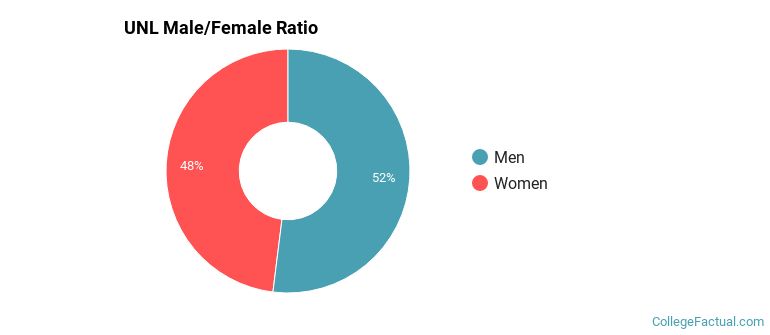
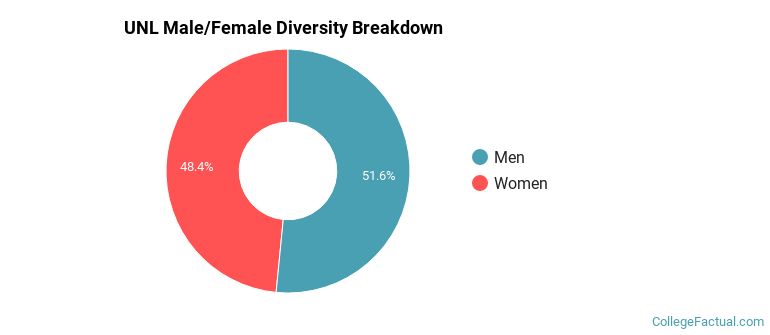
Male/Female Breakdown of Undergraduates
The full-time UNL undergraduate population is made up of 49% women, and 51% men.
For the gender breakdown for all students, go here.
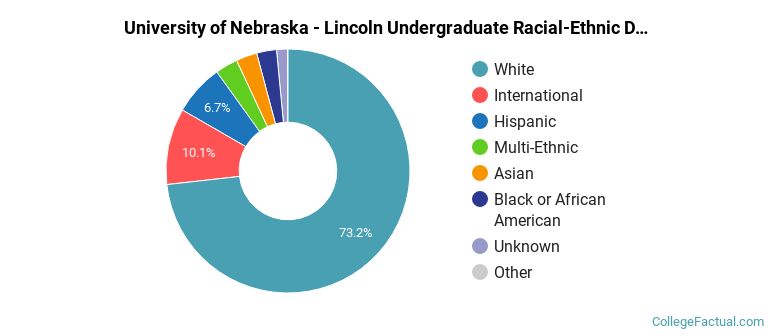
UNL Racial/Ethnic Breakdown of Undergraduates
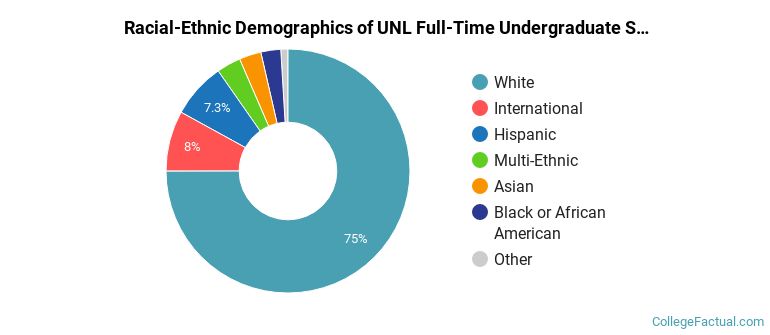
| Race/Ethnicity | Number |
|---|---|
| White | 14,300 |
| Hispanic | 1,528 |
| International | 1,133 |
| Multi-Ethnic | 639 |
| Asian | 617 |
| Black or African American | 519 |
| Unknown | 177 |
| Native Hawaiian or Pacific Islander | 7 |
See racial/ethnic breakdown for all students.
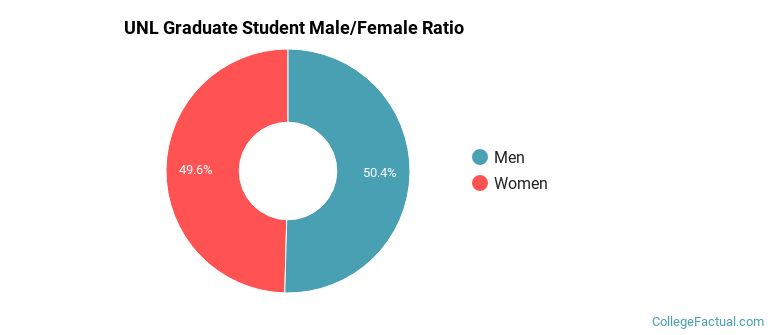
Male/Female Breakdown of Graduate Students
About 50% of full-time grad students are women, and 50% men.
For the gender breakdown for all students, go here.
UNL Racial-Ethnic Breakdown of Graduate Students
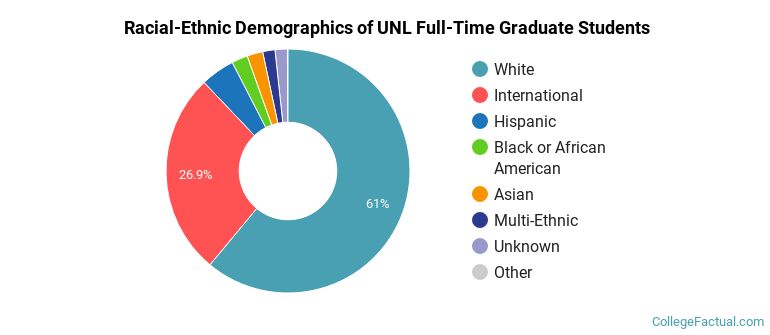
| Race/Ethnicity | Number |
|---|---|
| White | 1,598 |
| International | 658 |
| Hispanic | 123 |
| Asian | 62 |
| Multi-Ethnic | 52 |
| Unknown | 44 |
| Black or African American | 41 |
| Native Hawaiian or Pacific Islander | 1 |
See racial/ethnic breakdown for all students.
| Race/Ethnicity | Number |
|---|---|
| White | 18,448 |
| International | 2,099 |
| Hispanic | 1,850 |
| Asian | 795 |
| Multi-Ethnic | 770 |
| Black or African American | 663 |
| Unknown | 420 |
| Native Hawaiian or Pacific Islander | 10 |
There are approximately 12,322 female students and 12,786 male students at UNL.
UNL ranks 530 out of 2,183 when it comes to geographic diversity.
23.79% of UNL students come from out of state, and 6.3% come from out of the country.
The undergraduate student body is split among 40 states (may include Washington D.C.). Click on the map for more detail.
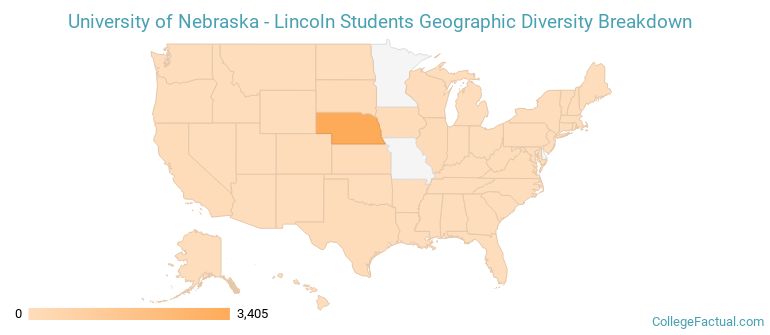
| State | Amount |
|---|---|
| Nebraska | 3,405 |
| Illinois | 148 |
| Colorado | 113 |
| South Dakota | 105 |
| Kansas | 82 |
Students from 110 countries are represented at this school, with the majority of the international students coming from China, Malaysia, and India.
Learn more about international students at UNL.
A traditional college student is defined as being between the ages of 18-21. At UNL, 62.91% of students fall into that category, compared to the national average of 60%.
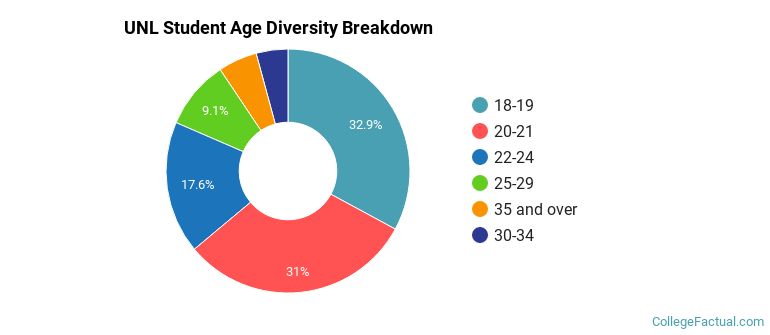
| Student Age Group | Amount |
|---|---|
| 18-19 | 8,444 |
| 20-21 | 7,962 |
| 22-24 | 4,509 |
| 25-29 | 2,341 |
| 35 and over | 1,329 |
| 30-34 | 1,081 |
| Under 18 | 0 |
Footnotes
*The racial-ethnic minorities count is calculated by taking the total number of students and subtracting white students, international students, and students whose race/ethnicity was unknown. This number is then divided by the total number of students at the school to obtain the racial-ethnic minorities percentage.
References
Department of Homeland Security Citizenship and Immigration Services
Image Credit: By (NONE LISTED, JUST A WEBSITE) www.mawhamba.net under License
Find out how College Factual created their Diversity Rankings.