Here, you'll find out more about the major, including such details as the number of graduates, what degree levels are offered, ethnicity of students, average salaries, and more. We've also included details on how UNR ranks compared to other colleges offering a major in ce.
Go directly to any of the following sections:
The ce major at UNR is not ranked on College Factual’s Best Colleges and Universities for Computer Engineering. This could be for a number of reasons, such as not having enough data on the major or school to make an accurate assessment of its quality.
During the 2021-2022 academic year, University of Nevada - Reno handed out 1 bachelor's degrees in computer engineering. This is a decrease of 99% over the previous year when 120 degrees were handed out.
In 2022, 33 students received their master’s degree in ce from UNR. This makes it the #36 most popular school for ce master’s degree candidates in the country.
In addition, 6 students received their doctoral degrees in ce in 2022, making the school the #18 most popular school in the United States for this category of students.
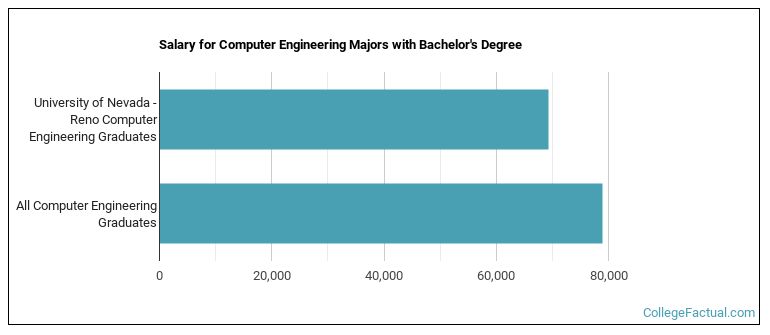
The median salary of ce students who receive their bachelor's degree at UNR is $69,310. This is less than $78,964, which is the national median of all ce majors in the nation who earn bachelor's degrees.
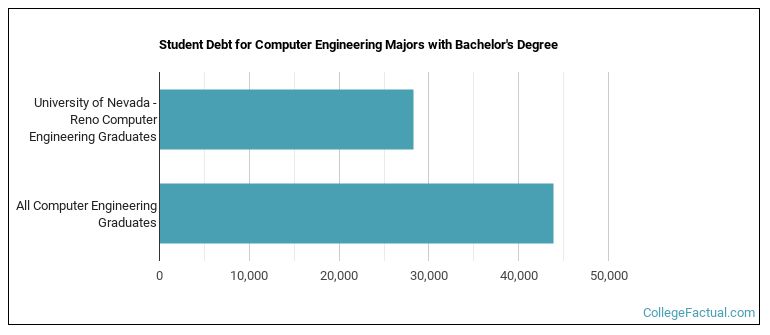
While getting their bachelor's degree at UNR, ce students borrow a median amount of $28,277 in student loans. This is not too bad considering that the median debt load of all ce bachelor's degree recipients across the country is $43,920.
In 2022-2023, the average part-time undergraduate tuition at UNR was $551 per credit hour for out-of-state students. The average for in-state students was $263 per credit hour. Information about average full-time undergraduate tuition and fees is shown in the table below.
| In State | Out of State | |
|---|---|---|
| Tuition | $7,876 | $24,832 |
| Fees | $1,118 | $1,118 |
| Books and Supplies | $1,200 | $1,200 |
| On Campus Room and Board | $13,700 | $13,700 |
| On Campus Other Expenses | $5,370 | $5,370 |
Learn more about UNR tuition and fees.
All of the 1 students who graduated with a Bachelor’s in ce from UNR in 2022 were men.

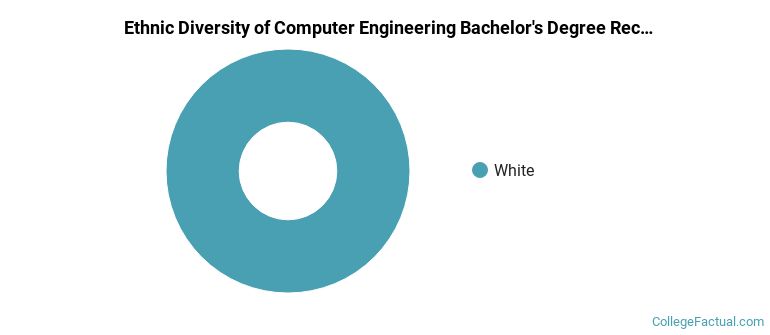
The majority of the students with this major are white. About 100% of 2022 graduates were in this category.
The following table and chart show the ethnic background for students who recently graduated from University of Nevada - Reno with a bachelor's in ce.
| Ethnic Background | Number of Students |
|---|---|
| Asian | 0 |
| Black or African American | 0 |
| Hispanic or Latino | 0 |
| White | 1 |
| Non-Resident Aliens | 0 |
| Other Races | 0 |
UNR does not offer an online option for its ce bachelor’s degree program at this time. To see if the school offers distance learning options in other areas, visit the UNR Online Learning page.
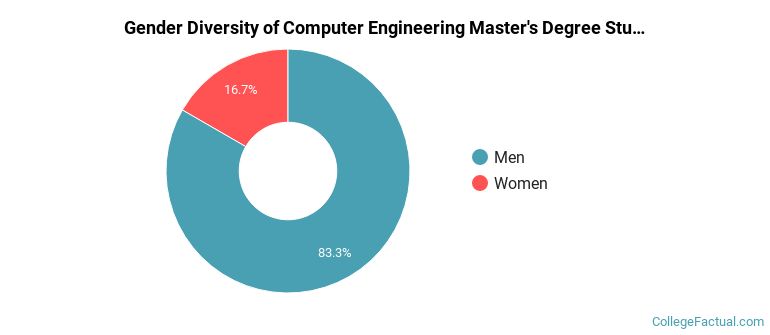
For the most recent academic year available, 83% of ce master's degrees went to men and 17% went to women.
The following table and chart show the ethnic background for students who recently graduated from University of Nevada - Reno with a master's in ce.
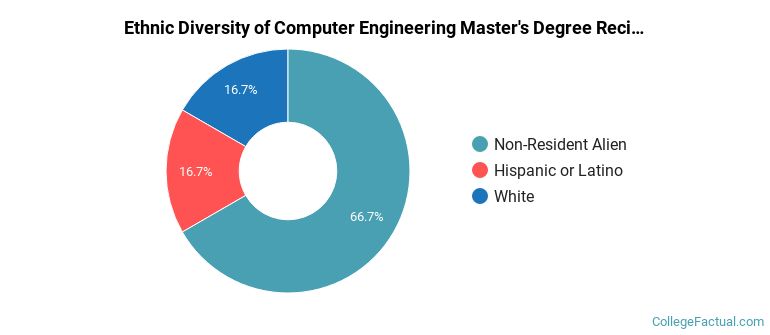
| Ethnic Background | Number of Students |
|---|---|
| Asian | 0 |
| Black or African American | 0 |
| Hispanic or Latino | 1 |
| White | 1 |
| Non-Resident Aliens | 4 |
| Other Races | 0 |
Take a look at the following statistics related to the make-up of the ce majors at University of Nevada - Reno.
| Related Major | Annual Graduates |
|---|---|
| Mechanical Engineering | 146 |
| Civil Engineering | 98 |
| Electrical Engineering | 66 |
| Chemical Engineering | 33 |
| Biomedical Engineering | 19 |
More about our data sources and methodologies.