UNR total enrollment is approximately 20,722 students. 14,323 are undergraduates and 1,595 are graduate students.
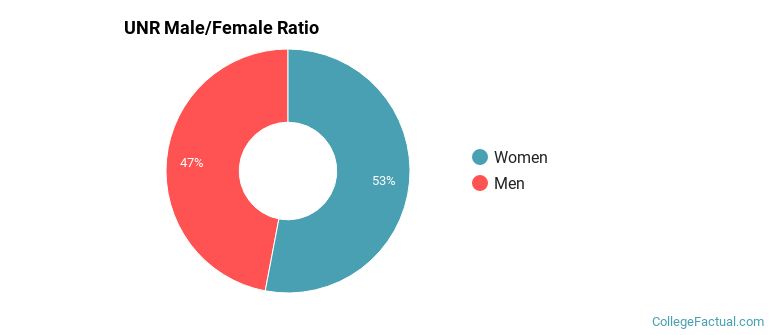
Male/Female Breakdown of Undergraduates
The full-time UNR undergraduate population is made up of 54% women, and 46% men.
For the gender breakdown for all students, go here.
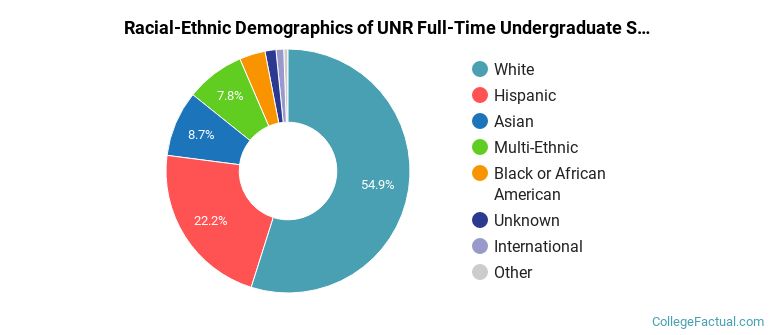
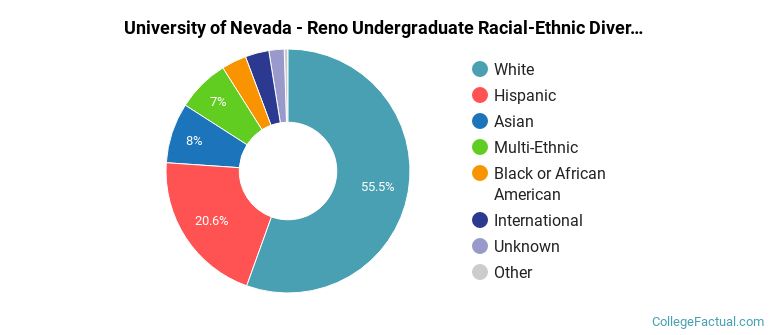
UNR Racial/Ethnic Breakdown of Undergraduates
| Race/Ethnicity | Number |
|---|---|
| White | 7,763 |
| Hispanic | 3,228 |
| Asian | 1,243 |
| Multi-Ethnic | 1,179 |
| Black or African American | 459 |
| Unknown | 189 |
| International | 117 |
| Native Hawaiian or Pacific Islander | 66 |
See racial/ethnic breakdown for all students.
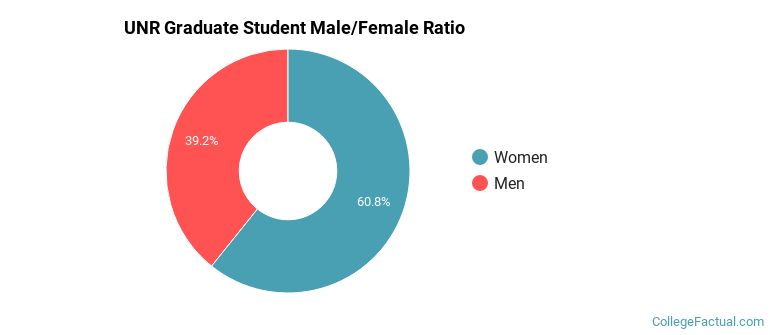
Male/Female Breakdown of Graduate Students
About 61% of full-time grad students are women, and 39% men.
For the gender breakdown for all students, go here.
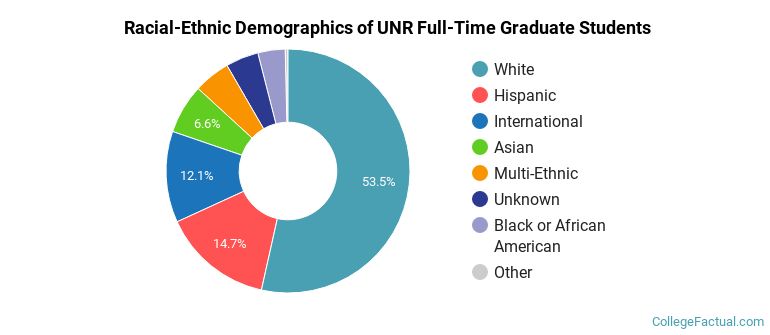
UNR Racial-Ethnic Breakdown of Graduate Students
| Race/Ethnicity | Number |
|---|---|
| White | 877 |
| Hispanic | 244 |
| International | 148 |
| Asian | 113 |
| Multi-Ethnic | 81 |
| Unknown | 68 |
| Black or African American | 55 |
| Native Hawaiian or Pacific Islander | 5 |
See racial/ethnic breakdown for all students.
| Race/Ethnicity | Number |
|---|---|
| White | 11,319 |
| Hispanic | 4,413 |
| Asian | 1,689 |
| Multi-Ethnic | 1,539 |
| Black or African American | 685 |
| International | 476 |
| Unknown | 396 |
| Native Hawaiian or Pacific Islander | 87 |

There are approximately 11,396 female students and 9,326 male students at UNR.
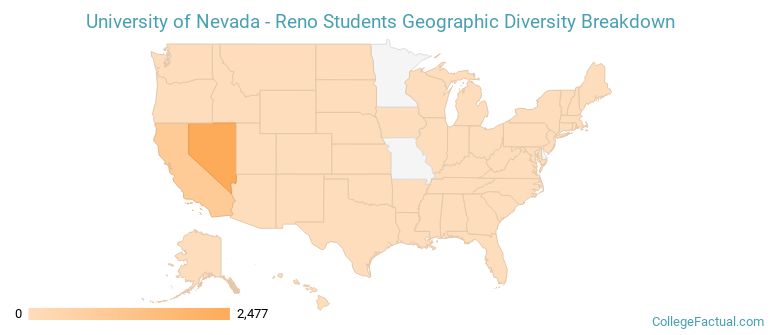
UNR ranks 867 out of 2,183 when it comes to geographic diversity.
29.57% of UNR students come from out of state, and 0.68% come from out of the country.
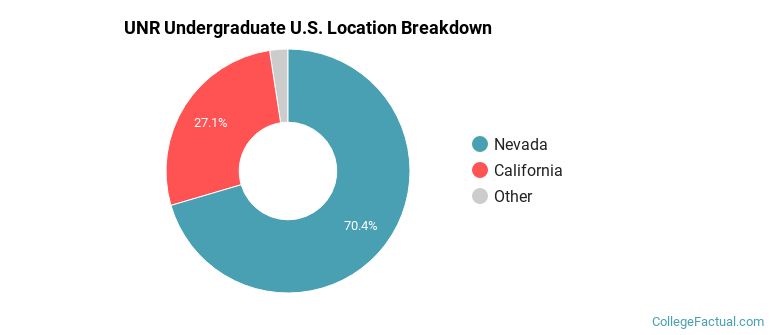
The undergraduate student body is split among 26 states (may include Washington D.C.). Click on the map for more detail.
| State | Amount |
|---|---|
| Nevada | 2,477 |
| California | 954 |
| Hawaii | 22 |
| Texas | 8 |
| Washington | 7 |
Students from 79 countries are represented at this school, with the majority of the international students coming from China, Japan, and India.
Learn more about international students at UNR.
A traditional college student is defined as being between the ages of 18-21. At UNR, 59.67% of students fall into that category, compared to the national average of 60%.
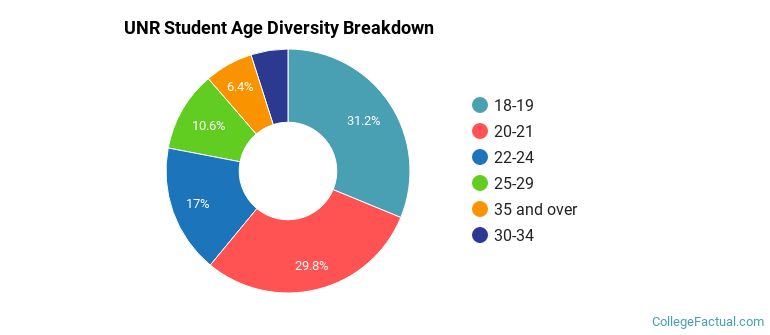
| Student Age Group | Amount |
|---|---|
| 18-19 | 6,615 |
| 20-21 | 6,307 |
| 22-24 | 3,608 |
| 25-29 | 2,256 |
| 35 and over | 1,360 |
| 30-34 | 1,041 |
| Under 18 | 0 |
Footnotes
*The racial-ethnic minorities count is calculated by taking the total number of students and subtracting white students, international students, and students whose race/ethnicity was unknown. This number is then divided by the total number of students at the school to obtain the racial-ethnic minorities percentage.
References
Department of Homeland Security Citizenship and Immigration Services
Read College Factual's Diversity Ranking Methodology.