Explore the best ranked schools for the programs you are most interested in.
UNE landed the #742 spot in College Factual's 2025 ranking of best overall colleges in the United States. The higher ed experts analyzed 2,152 colleges and universities across the nation to determine this ranking.
UNE is also ranked #6 out of 19 schools in Maine.
Because it has a high acceptance rate of 96%, some consider UNE to be a safety school. But don't just assume that admittance is in the bag. Make sure to spend enough time on your application so that it is in tip-top shape.
The student to faculty ratio at UNE is an impressive 12 to 1. That's quite good when you compare it to the national average of 15 to 1. This is a good sign that students at the school will have more opportunities for one-on-one interactions with their professors.
Another measure that is often used to estimate how much access students will have to their professors is how many faculty members are full-time. The idea here is that part-time faculty tend to spend less time on campus, so they may not be as available to students as full-timers.
The full-time faculty percentage at University of New England is 54%. This is higher than the national average of 47%.
The freshmen retention rate tells us what percentage of first-year, full-time students choose to continue on to their sophomore year at a particular school. The rate at University of New England is 70%, which is about average when compared to the national rate of 68%.
Students are considered to have graduated on time if they finish their studies within four years. At UNE the on-time graduation rate of first-time, full-time students is 56%. That is great when compared to the national average of 33.3%
Find out more about the retention and graduation rates at University of New England.
During the 2017-2018 academic year, there were 4,065 undergraduates at UNE with 2,292 being full-time and 1,773 being part-time.
| $0-30 K | $30K-48K | $48-75 | $75-110K | $110K + |
|---|---|---|---|---|
| $35,107 | $28,822 | $34,141 | $36,721 | $41,108 |
The net price is calculated by adding tuition, room, board and other costs and subtracting financial aid.Note that the net price is typically less than the published for a school. For more information on the sticker price of UNE, see our tuition and fees and room and board pages.
It's not uncommon for college students to take out loans to pay for school. In fact, almost 66% of students nationwide depend at least partially on loans. At UNE, approximately 94% of students took out student loans averaging $10,080 a year. That adds up to $40,320 over four years for those students.
Get more details about paying for University of New England.
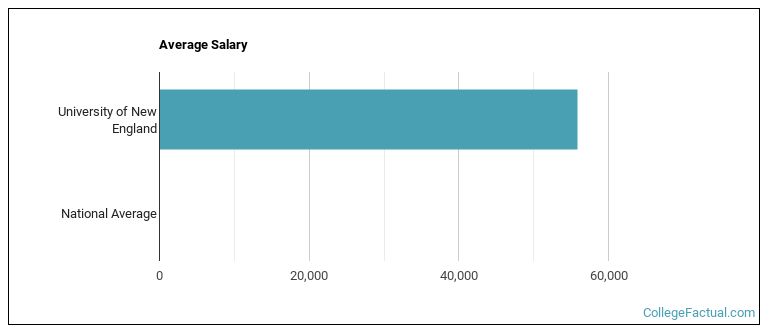
See which majors at University of New England make the most money.
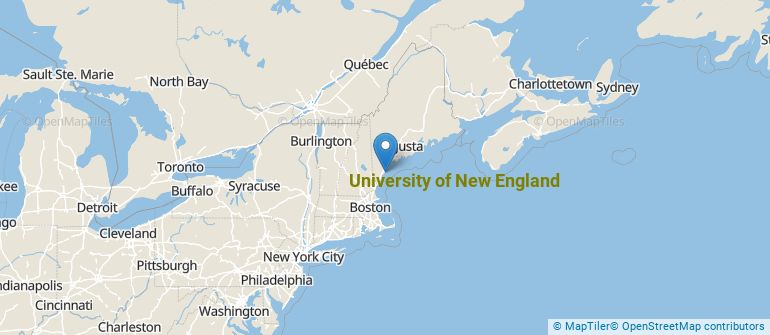
Get more details about the location of University of New England.
Contact details for UNE are given below.
| Contact Details | |
|---|---|
| Address: | 11 Hills Beach Rd, Biddeford, ME 04005-9599 |
| Phone: | 207-283-0171 |
| Website: | https://www.une.edu/ |
| Most Popular Majors | Bachelor’s Degrees | Average Salary of Graduates |
|---|---|---|
| Social Work | 164 | NA |
| Medicine | 162 | NA |
| Nursing | 136 | $77,895 |
| Teacher Education Grade Specific | 118 | $44,396 |
| Public Health | 114 | NA |
| Rehabilitation & Therapeutic Professions | 111 | NA |
| Educational Administration | 94 | NA |
| Health Sciences & Services | 64 | $30,169 |
| Dentistry | 61 | NA |
| Allied Health Professions | 59 | $27,832 |
Online learning is becoming popular at even the oldest colleges and universities in the United States. Not only are online classes great for returning adults with busy schedules, they are also frequented by a growing number of traditional students.
In 2022-2023, 2,670 students took at least one online class at University of New England. This is a decrease from the 2,921 students who took online classes the previous year.
| Year | Took at Least One Online Class | Took All Classes Online |
|---|---|---|
| 2022-2023 | 2,670 | 2,577 |
| 2021-2022 | 2,921 | 2,771 |
| 2020-2021 | 3,430 | 3,231 |
| 2018-2019 | 3,967 | 3,836 |
Learn more about online learning at University of New England.
If you’re considering University of New England, here are some more schools you may be interested in knowing more about.
Curious on how these schools stack up against UNE? Pit them head to head with College Combat, our free interactive tool that lets you compare college on the features that matter most to you!
Footnotes
*The racial-ethnic minorities count is calculated by taking the total number of students and subtracting white students, international students, and students whose race/ethnicity was unknown. This number is then divided by the total number of students at the school to obtain the racial-ethnic minorities percentage.
References
More about our data sources and methodologies.