UNE total enrollment is approximately 7,208 students. 2,292 are undergraduates and 2,593 are graduate students.
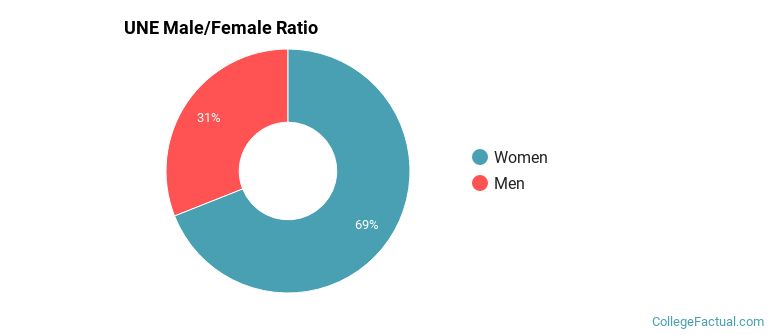
Male/Female Breakdown of Undergraduates
The full-time UNE undergraduate population is made up of 68% women, and 32% men.
For the gender breakdown for all students, go here.
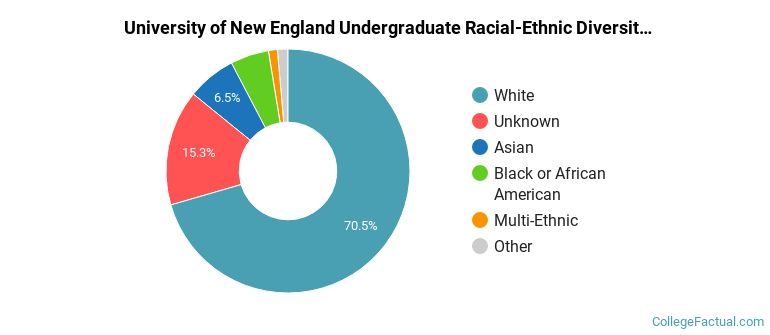
UNE Racial/Ethnic Breakdown of Undergraduates

| Race/Ethnicity | Number |
|---|---|
| White | 2,011 |
| Asian | 75 |
| Unknown | 72 |
| Multi-Ethnic | 61 |
| Black or African American | 30 |
| Hispanic | 27 |
| International | 10 |
| Native Hawaiian or Pacific Islander | 1 |
See racial/ethnic breakdown for all students.
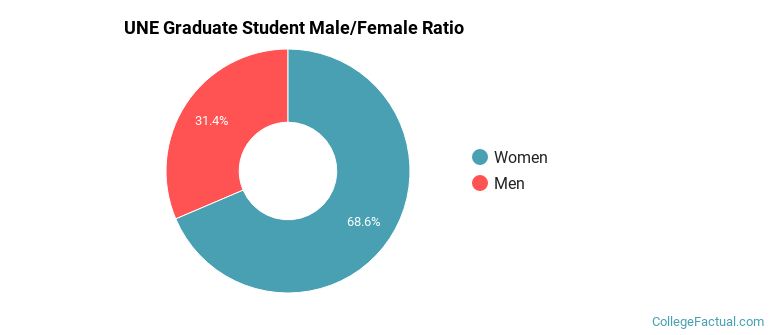
Male/Female Breakdown of Graduate Students
About 70% of full-time grad students are women, and 30% men.
For the gender breakdown for all students, go here.
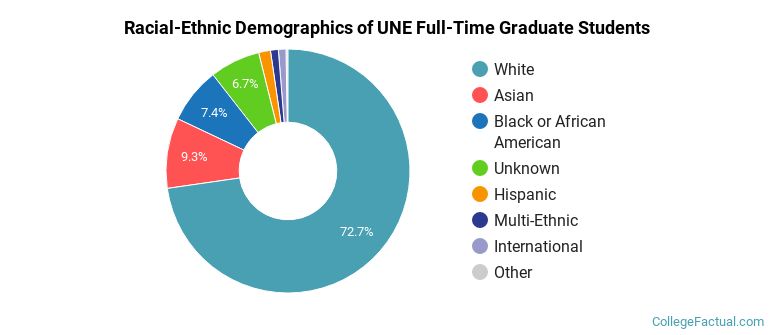
UNE Racial-Ethnic Breakdown of Graduate Students
| Race/Ethnicity | Number |
|---|---|
| White | 1,900 |
| Asian | 248 |
| Unknown | 174 |
| Black or African American | 157 |
| Hispanic | 42 |
| International | 27 |
| Multi-Ethnic | 25 |
| Native Hawaiian or Pacific Islander | 4 |
See racial/ethnic breakdown for all students.
| Race/Ethnicity | Number |
|---|---|
| White | 5,030 |
| Unknown | 1,110 |
| Asian | 483 |
| Black or African American | 337 |
| Multi-Ethnic | 90 |
| Hispanic | 76 |
| International | 38 |
| Native Hawaiian or Pacific Islander | 9 |

There are approximately 4,993 female students and 2,215 male students at UNE.
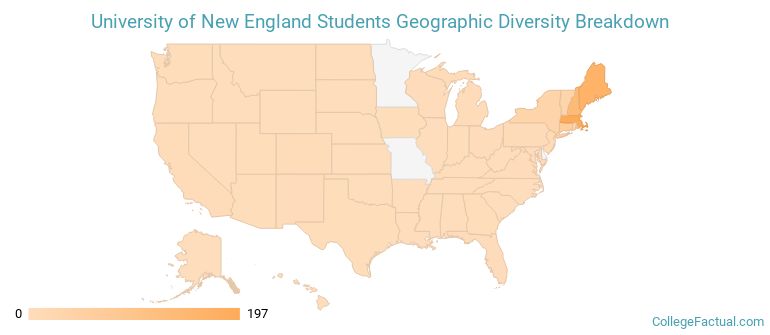
UNE ranks 327 out of 2,183 when it comes to geographic diversity.
76.74% of UNE students come from out of state, and 0.55% come from out of the country.
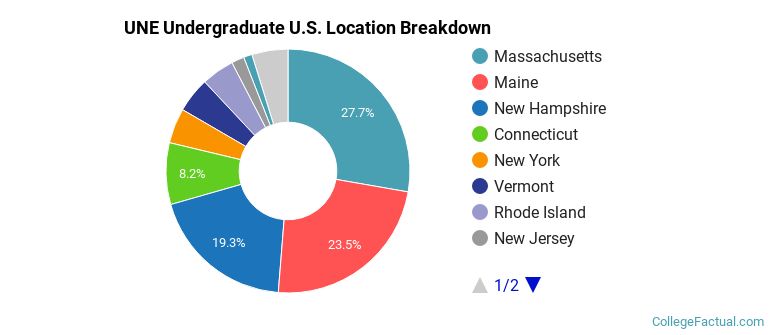
The undergraduate student body is split among 26 states (may include Washington D.C.). Click on the map for more detail.
| State | Amount |
|---|---|
| Massachusetts | 197 |
| Maine | 167 |
| New Hampshire | 137 |
| Connecticut | 58 |
| New York | 33 |
Students from 16 countries are represented at this school, with the majority of the international students coming from Canada, France, and Spain.
Learn more about international students at UNE.
A traditional college student is defined as being between the ages of 18-21. At UNE, 27.82% of students fall into that category, compared to the national average of 60%.
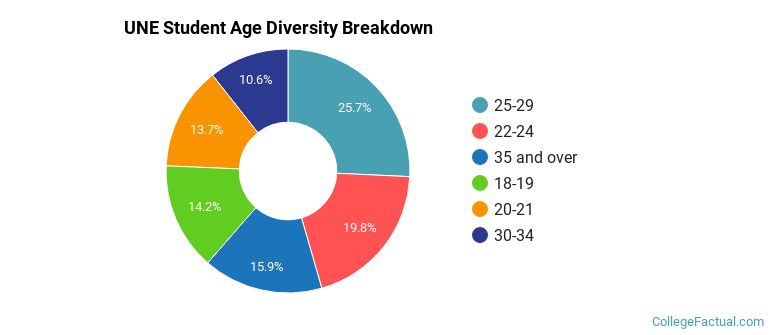
| Student Age Group | Amount |
|---|---|
| 25-29 | 2,121 |
| 22-24 | 1,631 |
| 35 and over | 1,310 |
| 18-19 | 1,174 |
| 20-21 | 1,130 |
| 30-34 | 875 |
| Under 18 | 0 |
Footnotes
*The racial-ethnic minorities count is calculated by taking the total number of students and subtracting white students, international students, and students whose race/ethnicity was unknown. This number is then divided by the total number of students at the school to obtain the racial-ethnic minorities percentage.
References
Department of Homeland Security Citizenship and Immigration Services
Read College Factual's Diversity Ranking Methodology.