Here is an overview of this program at UNM. Degrees are awarded at the Bachelor’s level, with graduate study also available. It ranks as high as #1 out of 1 schools (Bachelor’s level) by College Factual. Jump to any of the following sections:
By College Factual’s measure, UNM highly for ethnic studies, coming in at #107 out of 124 schools nationally.
| Ranking | Rank |
|---|---|
| Best Ethnic Studies Schools | 107 of 124 |
| Best Ethnic Studies Schools in New Mexico | 1 of 1 |
| Best Ethnic Studies Schools in the Southwest Region | 7 of 8 |
Here is each degree level offered in ethnic studies at UNM, along with how many graduates complete each level annually.
| Degree Level | Annual Graduates |
|---|---|
| Bachelor’s | 26 |
| Master’s | 10 |
| Professional Certificate | 1 |
In the most recent year for which we have data, University of New Mexico-Main Campus handed out 26 bachelor’s degrees in ethnic studies.
UNM is among the very best schools in the country for ethnic studies at the bachelor’s level. Its best result was #1 out of 1 schools by College Factual.
| Ranking | Rank |
|---|---|
| Best Ethnic Studies Bachelor’s Degree Schools in New Mexico | 1 |
| Best Ethnic Studies Bachelor’s Degree Schools in the Southwest Region | 6 |
| Best Ethnic Studies Bachelor’s Degree Schools | 92 |
Ethnic Studies students who finish a bachelor’s at UNM earn a median of $43,723 a year. This is below $59,099, the median for all majors at UNM.
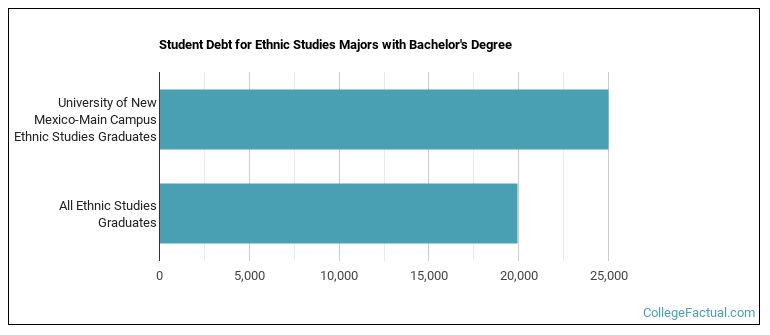
To complete a bachelor’s at UNM, ethnic studies students accumulate a median of $25,000 in student loans. This is above $19,961, the typical median for all majors at UNM.
Average full-time tuition and fees are listed in the table below.
| In State | Out of State | |
|---|---|---|
| Tuition | $6,604 | $31,422 |
| Fees | $1,638 | $1,638 |
Learn more about UNM tuition and fees.
In the most recent graduating class, 23% of ethnic studies bachelor’s degrees went to men and 77% went to women.
 The largest share of ethnic studies bachelor’s degree graduates at UNM were Hispanic or Latino. Approximately 58% of graduates fell into this category.
The following table and chart show the ethnic background for students who recently graduated from University of New Mexico-Main Campus with a bachelor’s in ethnic studies.
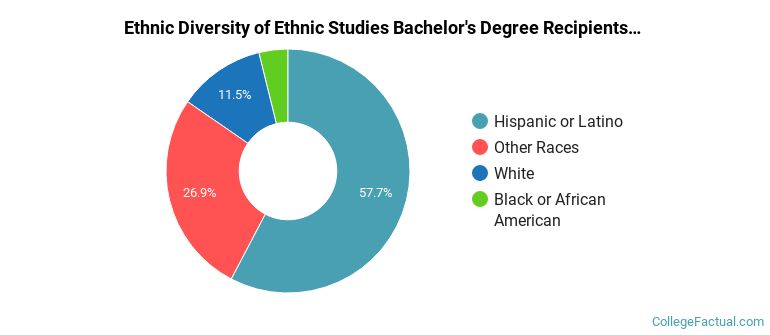
| Ethnic Background | Number of Students |
|---|---|
| Asian | 0 |
| Black or African American | 1 |
| Hispanic or Latino | 15 |
| White | 3 |
| Non-Resident Aliens | 0 |
| Other Races | 7 |
UNM granted 9 bachelor’s degrees in american indian/native american studies in the latest year of data — 89% to women and 11% to men. The most common background among these graduates was Hispanic or Latino (33%).
UNM granted 8 bachelor’s completions in hispanic-american, puerto rican, and mexican-american/chicano studies recently — 62% to women and 38% to men. The most common background among these graduates was Hispanic or Latino (100%).
UNM awarded 8 bachelor’s degrees in women’s studies in the most recent reporting year — 75% to women and 25% to men. The most common background among these graduates was Hispanic or Latino (50%).
UNM conferred 1 bachelor’s completion in african-american/black studies recently — 100% to women and 0% to men. Most of these graduates identified as Black or African American (100%).
Graduate study is also available at UNM. Annual graduate completions by level are shown below.
| Graduate Level | Annual Graduates |
|---|---|
| Master’s Degrees in Ethnic Studies | 10 |
| Professional Certificate Degrees in Ethnic Studies | 1 |
