UNM total enrollment is approximately 22,311 students. 12,124 are undergraduates and 3,062 are graduate students.
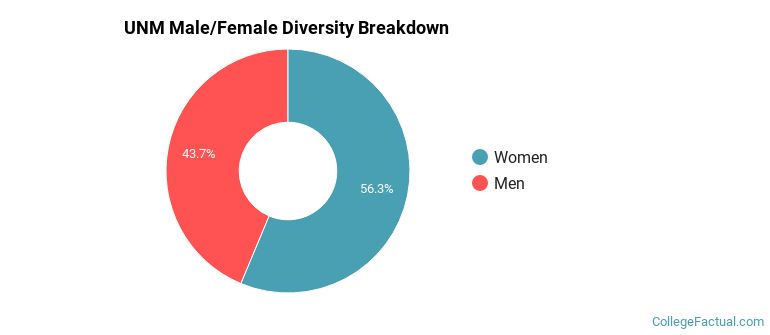
Male/Female Breakdown of Undergraduates
The full-time UNM undergraduate population is made up of 58% women, and 42% men.

For the gender breakdown for all students, go here.
UNM Racial/Ethnic Breakdown of Undergraduates

| Race/Ethnicity | Number |
|---|---|
| Hispanic | 6,126 |
| White | 3,594 |
| Asian | 526 |
| Multi-Ethnic | 484 |
| International | 352 |
| Black or African American | 320 |
| Unknown | 146 |
| Native Hawaiian or Pacific Islander | 25 |
See racial/ethnic breakdown for all students.
Male/Female Breakdown of Graduate Students
About 56% of full-time grad students are women, and 44% men.

For the gender breakdown for all students, go here.
UNM Racial-Ethnic Breakdown of Graduate Students

| Race/Ethnicity | Number |
|---|---|
| White | 1,201 |
| Hispanic | 1,029 |
| International | 284 |
| Asian | 176 |
| Multi-Ethnic | 92 |
| Unknown | 86 |
| Black or African American | 68 |
| Native Hawaiian or Pacific Islander | 6 |
See racial/ethnic breakdown for all students.

| Race/Ethnicity | Number |
|---|---|
| Hispanic | 9,997 |
| White | 7,423 |
| International | 1,005 |
| Asian | 952 |
| Multi-Ethnic | 764 |
| Black or African American | 558 |
| Unknown | 385 |
| Native Hawaiian or Pacific Islander | 37 |
There are approximately 12,824 female students and 9,487 male students at UNM.
UNM ranks 627 out of 2,183 when it comes to geographic diversity.
15.15% of UNM students come from out of state, and 1.35% come from out of the country.
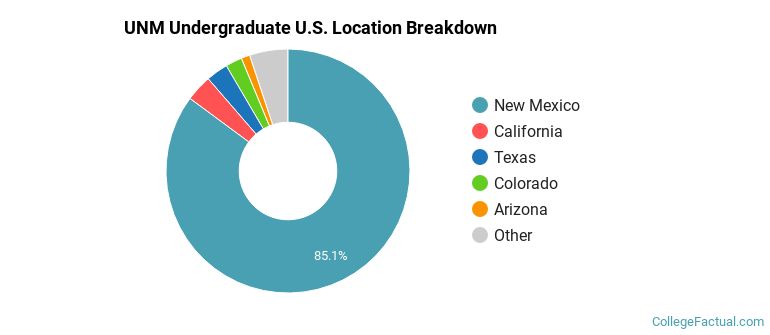
The undergraduate student body is split among 39 states (may include Washington D.C.). Click on the map for more detail.

| State | Amount |
|---|---|
| New Mexico | 2,835 |
| California | 117 |
| Texas | 97 |
| Colorado | 73 |
| Arizona | 38 |
Students from 106 countries are represented at this school, with the majority of the international students coming from China, India, and Nepal.
Learn more about international students at UNM.
A traditional college student is defined as being between the ages of 18-21. At UNM, 44.03% of students fall into that category, compared to the national average of 60%.
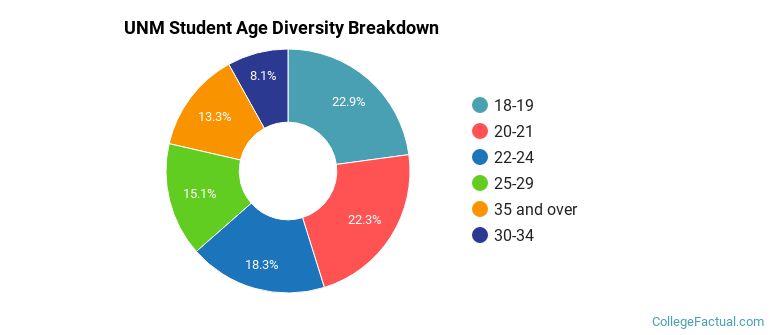
| Student Age Group | Amount |
|---|---|
| 18-19 | 5,840 |
| 20-21 | 5,705 |
| 22-24 | 4,686 |
| 25-29 | 3,852 |
| 35 and over | 3,406 |
| 30-34 | 2,062 |
| Under 18 | 0 |
Footnotes
*The racial-ethnic minorities count is calculated by taking the total number of students and subtracting white students, international students, and students whose race/ethnicity was unknown. This number is then divided by the total number of students at the school to obtain the racial-ethnic minorities percentage.
References
Department of Homeland Security Citizenship and Immigration Services
Image Credit: By PerryPlanet under License
Read College Factual's Diversity Ranking Methodology.