Here, you'll find out more about the major, including such details as the number of graduates, what degree levels are offered, ethnicity of students, average salaries, and more. We've also included details on how UNC Chapel Hill ranks compared to other colleges offering a major in economics.
Jump to any of the following sections:
UNC Chapel Hill is in the top 10% of the country for economics. More specifically it was ranked #23 out of 407 schools by College Factual. It is also ranked #2 in North Carolina.
During the 2021-2022 academic year, University of North Carolina at Chapel Hill handed out 449 bachelor's degrees in economics. This is an increase of 10% over the previous year when 409 degrees were handed out.
In 2022, 3 students received their master’s degree in economics from UNC Chapel Hill. This makes it the #183 most popular school for economics master’s degree candidates in the country.
In addition, 7 students received their doctoral degrees in economics in 2022, making the school the #62 most popular school in the United States for this category of students.
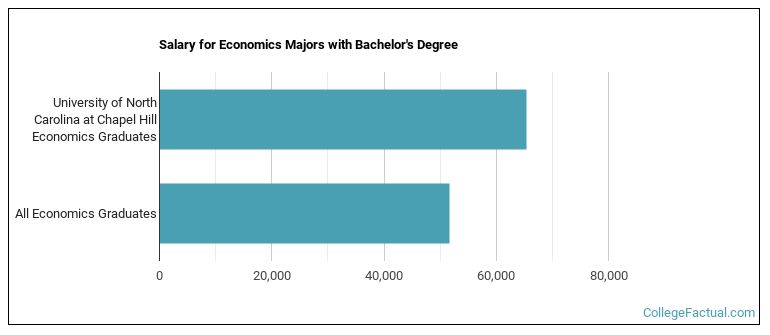
Economics majors who earn their bachelor's degree from UNC Chapel Hill go on to jobs where they make a median salary of $65,344 a year. This is great news for graduates of the program, since this figure is higher than the national average of $51,722 for all economics bachelor's degree recipients.
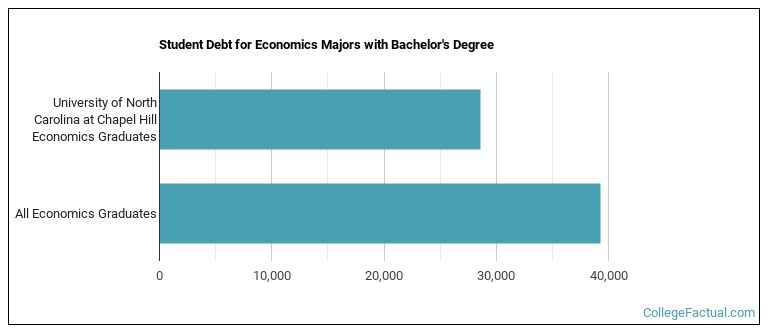
While getting their bachelor's degree at UNC Chapel Hill, economics students borrow a median amount of $28,624 in student loans. This is not too bad considering that the median debt load of all economics bachelor's degree recipients across the country is $39,273.
The typical student loan payment of a bachelor's degree student from the economics program at UNC Chapel Hill is $245 per month.
Out-of-state part-time undergraduates at UNC Chapel Hill paid an average of $1,557 per credit hour in 2022-2023. The average for in-state students was $292 per credit hour. The average full-time tuition and fees for undergraduates are shown in the table below.
| In State | Out of State | |
|---|---|---|
| Tuition | $7,019 | $37,360 |
| Fees | $1,970 | $1,970 |
| Books and Supplies | $1,290 | $1,290 |
| On Campus Room and Board | $13,016 | $13,016 |
| On Campus Other Expenses | $2,814 | $2,814 |
Learn more about UNC Chapel Hill tuition and fees.
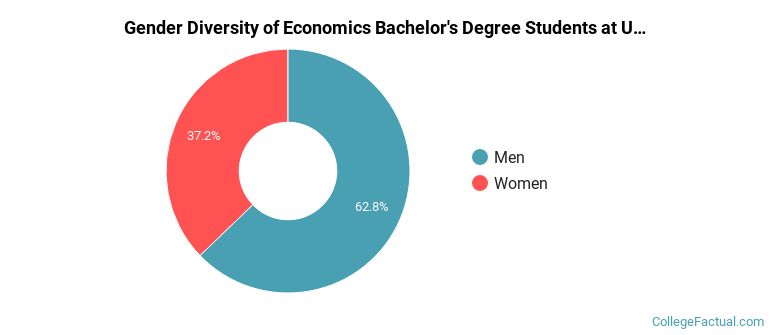
During the 2021-2022 academic year, 449 students graduated with a bachelor's degree in economics from UNC Chapel Hill. About 63% were men and 37% were women.
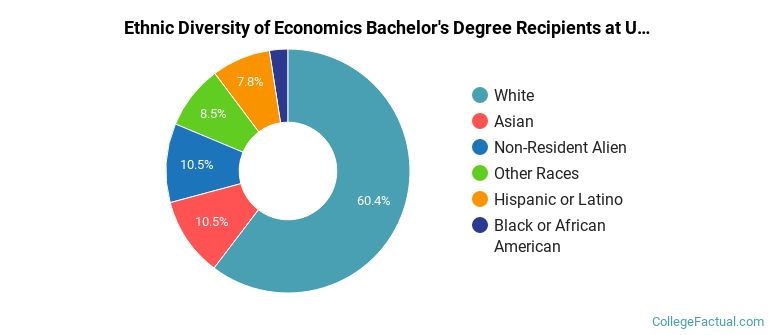
The majority of the students with this major are white. About 60% of 2022 graduates were in this category.
The following table and chart show the ethnic background for students who recently graduated from University of North Carolina at Chapel Hill with a bachelor's in economics.
| Ethnic Background | Number of Students |
|---|---|
| Asian | 47 |
| Black or African American | 11 |
| Hispanic or Latino | 35 |
| White | 271 |
| Non-Resident Aliens | 47 |
| Other Races | 38 |
UNC Chapel Hill does not offer an online option for its economics bachelor’s degree program at this time. To see if the school offers distance learning options in other areas, visit the UNC Chapel Hill Online Learning page.
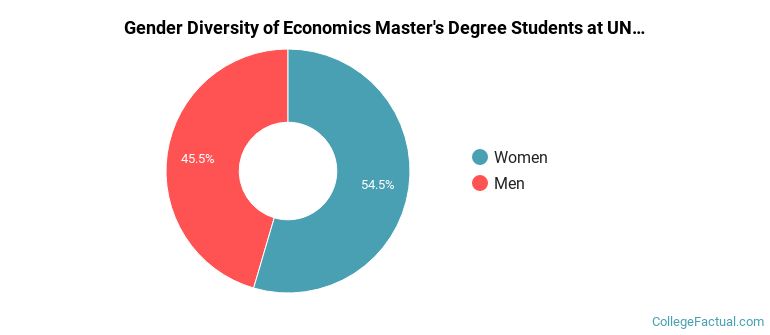
During the 2021-2022 academic year, 11 students graduated with a master's degree in economics from UNC Chapel Hill. About 45% were men and 55% were women.
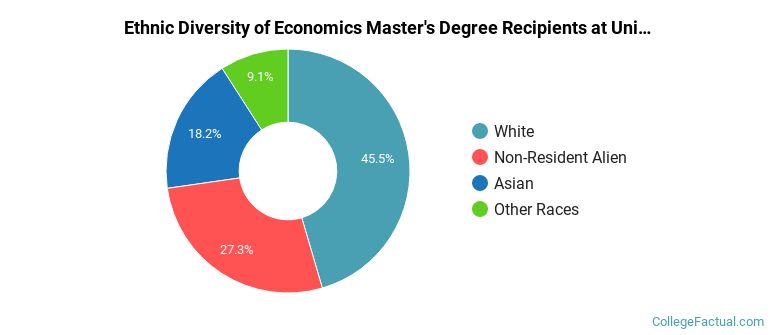
The following table and chart show the ethnic background for students who recently graduated from University of North Carolina at Chapel Hill with a master's in economics.
| Ethnic Background | Number of Students |
|---|---|
| Asian | 2 |
| Black or African American | 0 |
| Hispanic or Latino | 0 |
| White | 5 |
| Non-Resident Aliens | 3 |
| Other Races | 1 |
Take a look at the following statistics related to the make-up of the economics majors at University of North Carolina at Chapel Hill.
| Related Major | Annual Graduates |
|---|---|
| Political Science & Government | 365 |
| Sociology | 116 |
| Anthropology | 94 |
| Geography & Cartography | 30 |
| Archeology | 8 |
More about our data sources and methodologies.