Below are the key facts about this program at UNCG. You can study it at the Bachelor’s level, with graduate study also available. It ranks as high as #3 out of 4 schools (Bachelor’s level) by College Factual. Jump to any of the following sections:
By College Factual’s measure, UNCG among the top schools in the country for ethnic studies, placing at #116 out of 124 schools nationally.
| Ranking | Rank |
|---|---|
| Best Ethnic Studies Schools | 116 of 124 |
| Best Ethnic Studies Schools in North Carolina | 3 of 4 |
| Best Ethnic Studies Schools in the Southeast Region | 12 of 14 |
The following degree levels are available for ethnic studies at UNCG, along with how many graduates complete each level annually.
| Degree Level | Annual Graduates |
|---|---|
| Bachelor’s | 20 |
| Master’s | 5 |
| Graduate Certificate | 3 |
In the most recent year for which we have data, University of North Carolina at Greensboro handed out 20 bachelor’s degrees in ethnic studies.
UNCG ranks competitively among schools offering ethnic studies at the bachelor’s level. In particular it placed #3 out of 4 schools by College Factual.
Ethnic Studies graduates with a bachelor’s degree from UNCG earn a median of $28,447 a year. This is lower than $54,048, the median for all majors at UNCG.
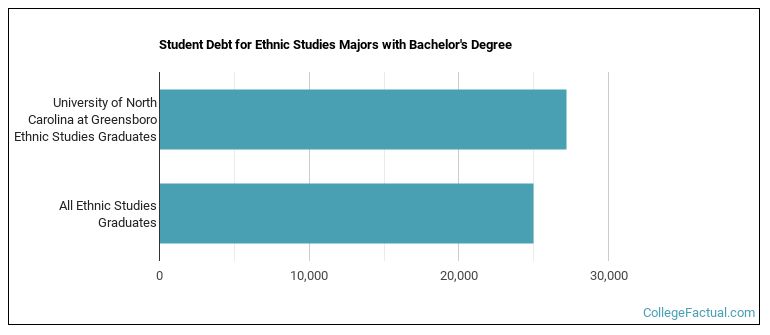
Earning a bachelor’s degree at UNCG, ethnic studies graduates take on a median debt of $27,210 in student loans. This is higher than $24,977, the typical median for all majors at UNCG.
Information about average full-time undergraduate tuition and fees is shown in the table below.
| In State | Out of State | |
|---|---|---|
| Tuition | $4,422 | $20,773 |
| Fees | $3,239 | $3,239 |
Read more about UNCG tuition and fees.
Among recent graduates, 40% of ethnic studies bachelor’s degrees went to men and 60% went to women.
 The majority of ethnic studies bachelor’s degree graduates at UNCG were Black or African American. Roughly 60% of graduates fell into this category.
The following table and chart show the ethnic background for students who recently graduated from University of North Carolina at Greensboro with a bachelor’s in ethnic studies.
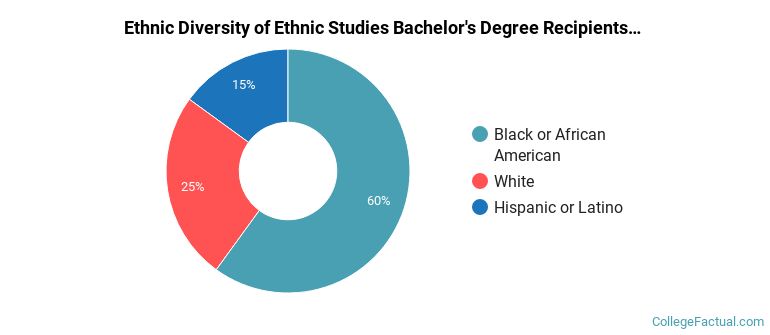
| Ethnic Background | Number of Students |
|---|---|
| Asian | 0 |
| Black or African American | 12 |
| Hispanic or Latino | 3 |
| White | 5 |
| Non-Resident Aliens | 0 |
| Other Races | 0 |
UNCG granted 12 bachelor’s degrees in african-american/black studies in the latest year of data — 58% to women and 42% to men. The most common background among these graduates was Black or African American (92%).
UNCG awarded 8 bachelor’s completions in women’s studies recently — 62% to women and 38% to men. Most of these graduates identified as White (50%).
This program is also offered at the graduate level at UNCG. Annual graduate completions by level are shown below.
| Graduate Level | Annual Graduates |
|---|---|
| Master’s Degrees in Ethnic Studies | 5 |
| Graduate Certificate Degrees in Ethnic Studies | 3 |
