UNF total enrollment is approximately 16,926 students. 10,817 are undergraduates and 1,050 are graduate students.
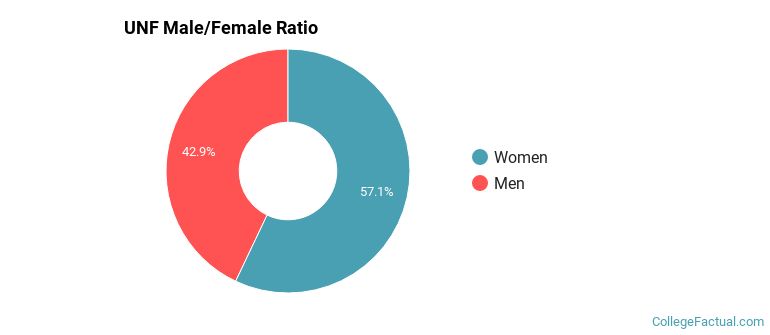
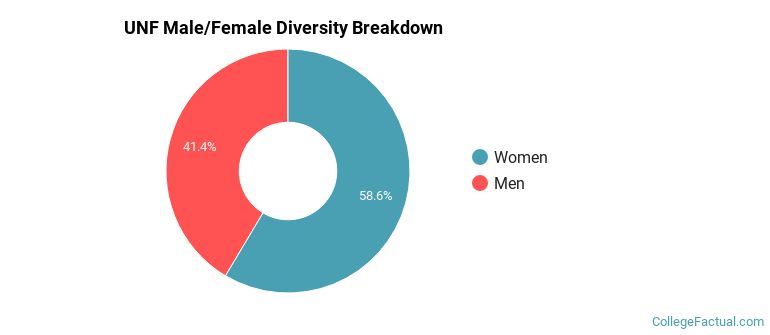
Male/Female Breakdown of Undergraduates
The full-time UNF undergraduate population is made up of 57% women, and 43% men.
For the gender breakdown for all students, go here.
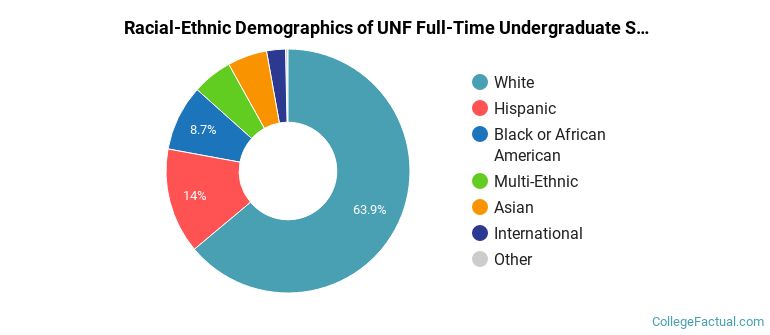
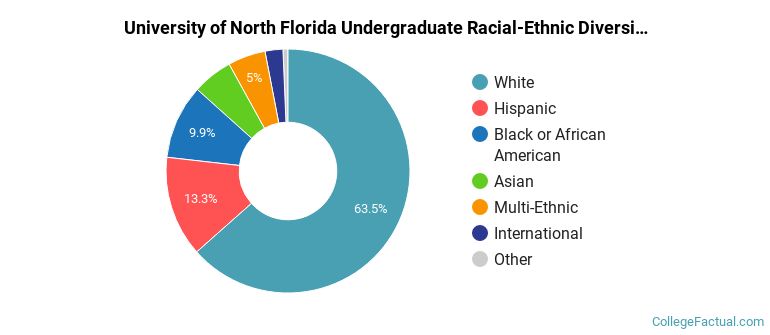
UNF Racial/Ethnic Breakdown of Undergraduates
| Race/Ethnicity | Number |
|---|---|
| White | 6,711 |
| Hispanic | 1,611 |
| Black or African American | 1,058 |
| Multi-Ethnic | 589 |
| Asian | 584 |
| International | 207 |
| Unknown | 32 |
| Native Hawaiian or Pacific Islander | 11 |
See racial/ethnic breakdown for all students.
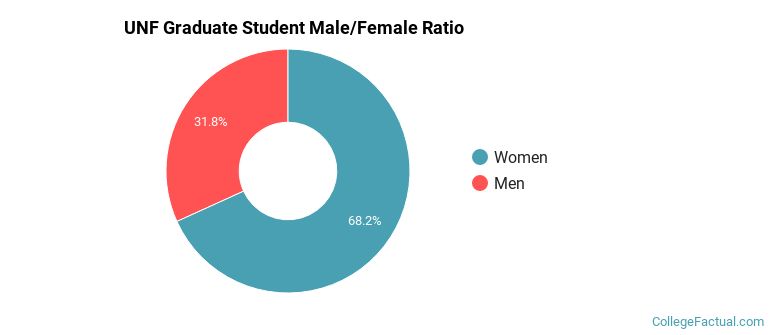
Male/Female Breakdown of Graduate Students
About 70% of full-time grad students are women, and 30% men.
For the gender breakdown for all students, go here.
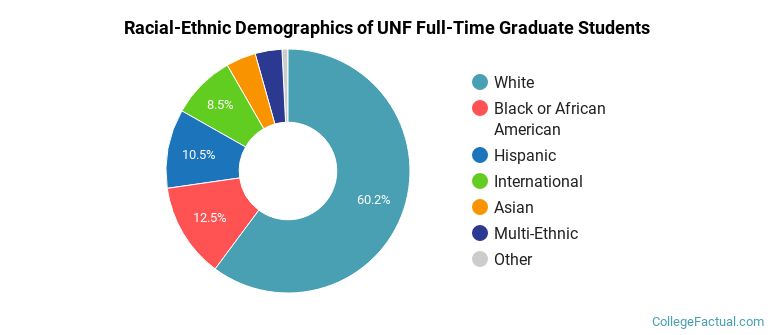
UNF Racial-Ethnic Breakdown of Graduate Students
| Race/Ethnicity | Number |
|---|---|
| White | 625 |
| Black or African American | 127 |
| Hispanic | 119 |
| International | 72 |
| Asian | 54 |
| Multi-Ethnic | 42 |
| Unknown | 8 |
| Native Hawaiian or Pacific Islander | 2 |
See racial/ethnic breakdown for all students.
| Race/Ethnicity | Number |
|---|---|
| White | 10,492 |
| Hispanic | 2,403 |
| Black or African American | 1,780 |
| Asian | 948 |
| Multi-Ethnic | 849 |
| International | 324 |
| Unknown | 82 |
| Native Hawaiian or Pacific Islander | 25 |
There are approximately 9,962 female students and 6,964 male students at UNF.
UNF ranks 1,411 out of 2,183 when it comes to geographic diversity.
3.72% of UNF students come from out of state, and 2.02% come from out of the country.
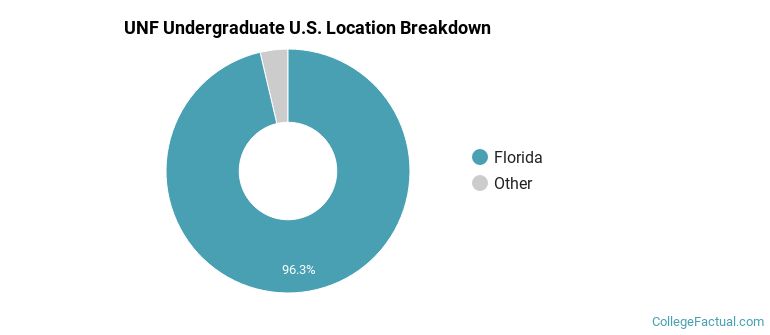
The undergraduate student body is split among 23 states (may include Washington D.C.). Click on the map for more detail.
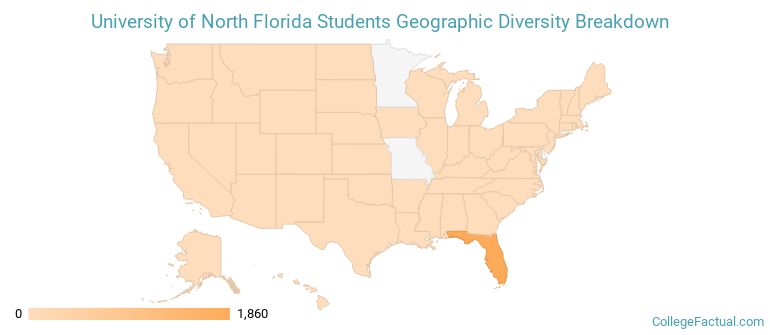
| State | Amount |
|---|---|
| Florida | 1,860 |
| Virginia | 16 |
| Georgia | 10 |
| Maryland | 6 |
| North Carolina | 5 |
Students from 78 countries are represented at this school, with the majority of the international students coming from Saudi Arabia, Kuwait, and Brazil.
Learn more about international students at UNF.
A traditional college student is defined as being between the ages of 18-21. At UNF, 49.40% of students fall into that category, compared to the national average of 60%.
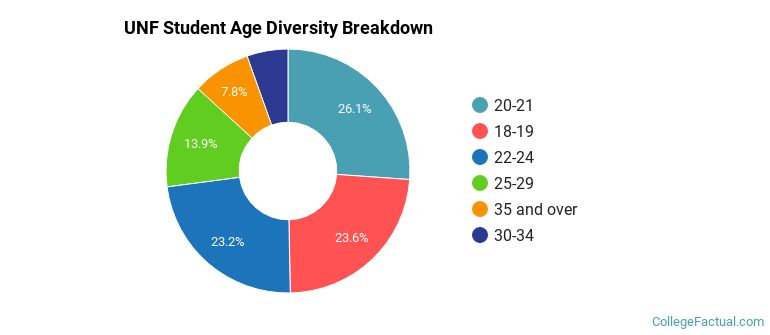
| Student Age Group | Amount |
|---|---|
| 20-21 | 4,233 |
| 18-19 | 3,823 |
| 22-24 | 3,762 |
| 25-29 | 2,248 |
| 35 and over | 1,258 |
| 30-34 | 884 |
| Under 18 | 0 |
Footnotes
*The racial-ethnic minorities count is calculated by taking the total number of students and subtracting white students, international students, and students whose race/ethnicity was unknown. This number is then divided by the total number of students at the school to obtain the racial-ethnic minorities percentage.
References
Department of Homeland Security Citizenship and Immigration Services
Find out how College Factual created their Diversity Rankings.