UNT total enrollment is approximately 40,953 students. 26,353 are undergraduates and 3,647 are graduate students.
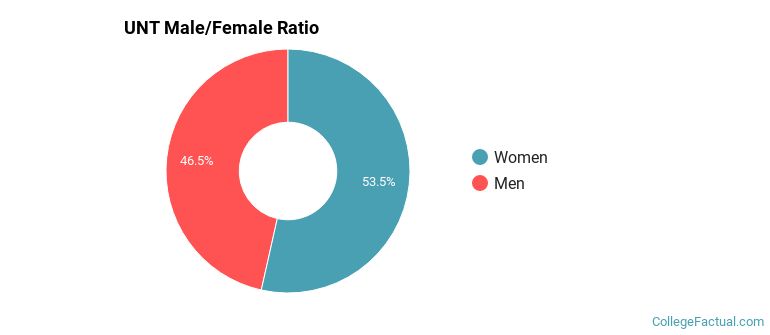
Male/Female Breakdown of Undergraduates
The full-time UNT undergraduate population is made up of 54% women, and 46% men.
For the gender breakdown for all students, go here.
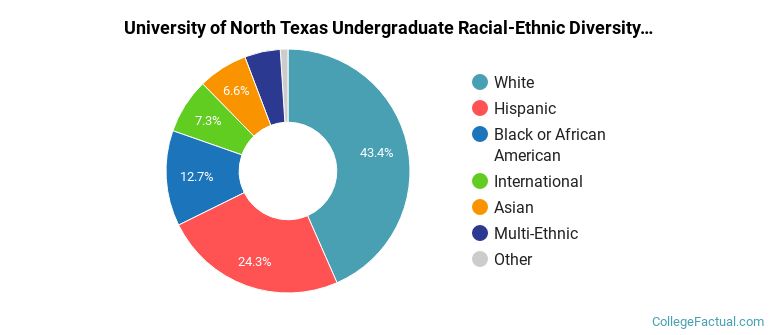
UNT Racial/Ethnic Breakdown of Undergraduates
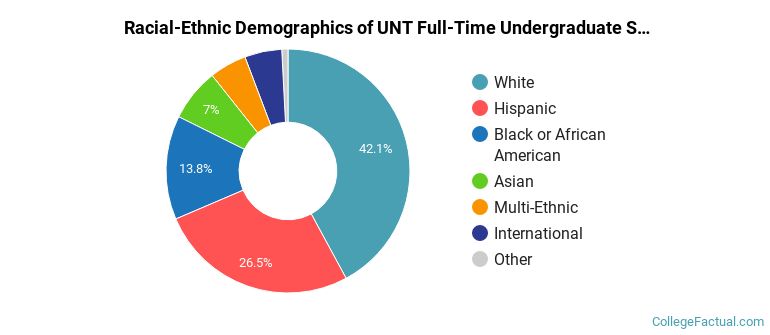
| Race/Ethnicity | Number |
|---|---|
| White | 10,829 |
| Hispanic | 7,128 |
| Black or African American | 3,763 |
| Asian | 1,914 |
| Multi-Ethnic | 1,239 |
| International | 1,236 |
| Unknown | 165 |
| Native Hawaiian or Pacific Islander | 19 |
See racial/ethnic breakdown for all students.
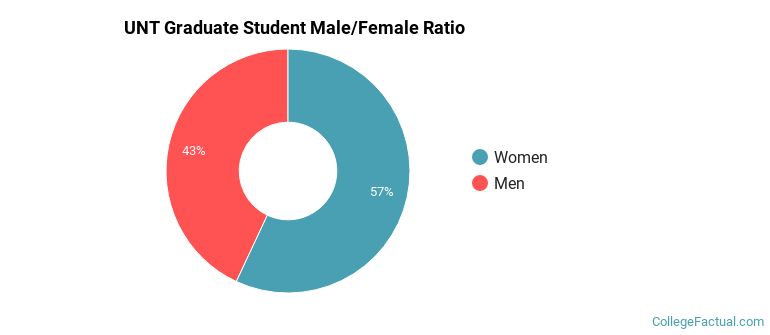
Male/Female Breakdown of Graduate Students
About 57% of full-time grad students are women, and 43% men.
For the gender breakdown for all students, go here.
UNT Racial-Ethnic Breakdown of Graduate Students
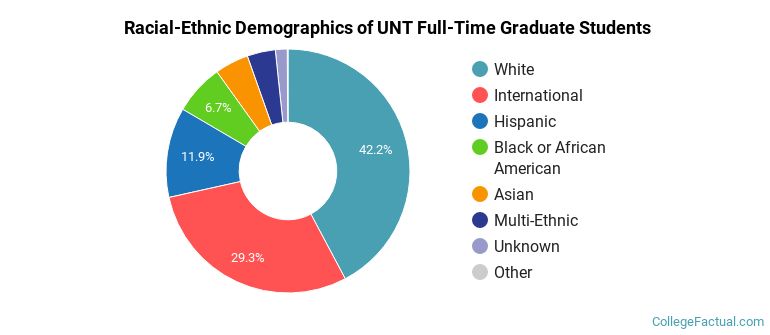
| Race/Ethnicity | Number |
|---|---|
| White | 1,508 |
| International | 1,045 |
| Hispanic | 468 |
| Black or African American | 268 |
| Asian | 184 |
| Multi-Ethnic | 134 |
| Unknown | 34 |
| Native Hawaiian or Pacific Islander | 0 |
See racial/ethnic breakdown for all students.
| Race/Ethnicity | Number |
|---|---|
| White | 17,292 |
| Hispanic | 10,140 |
| Black or African American | 5,330 |
| International | 3,052 |
| Asian | 2,817 |
| Multi-Ethnic | 1,864 |
| Unknown | 322 |
| Native Hawaiian or Pacific Islander | 26 |

There are approximately 22,419 female students and 18,534 male students at UNT.
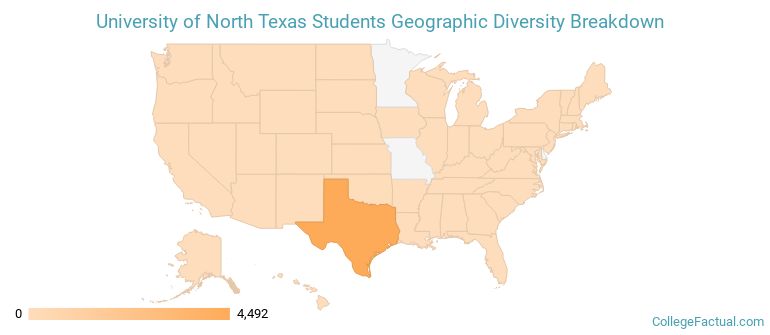
UNT ranks 911 out of 2,183 when it comes to geographic diversity.
4.01% of UNT students come from out of state, and 3.38% come from out of the country.
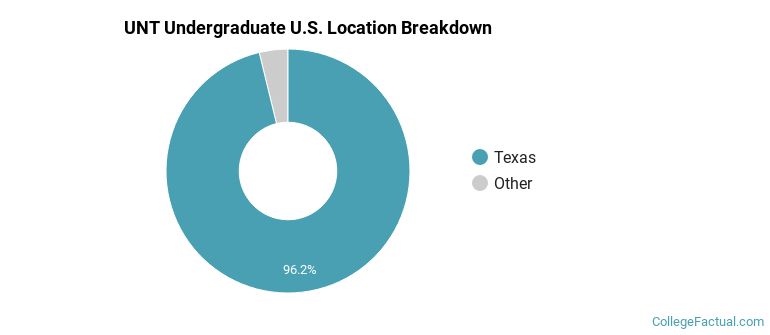
The undergraduate student body is split among 41 states (may include Washington D.C.). Click on the map for more detail.
| State | Amount |
|---|---|
| Texas | 4,492 |
| Oklahoma | 27 |
| Illinois | 18 |
| California | 17 |
| Virginia | 11 |
Students from 121 countries are represented at this school, with the majority of the international students coming from India, China, and Saudi Arabia.
Learn more about international students at UNT.
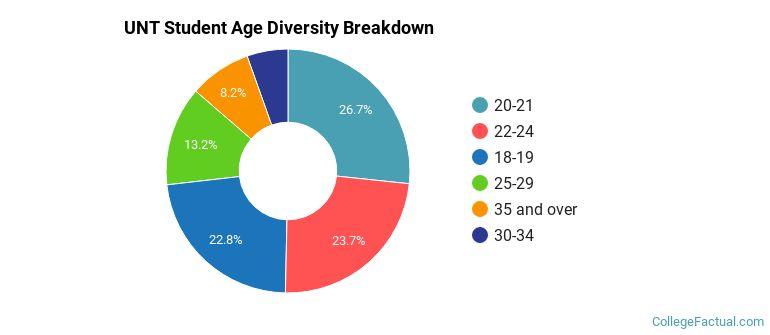
A traditional college student is defined as being between the ages of 18-21. At UNT, 48.77% of students fall into that category, compared to the national average of 60%.
| Student Age Group | Amount |
|---|---|
| 20-21 | 10,053 |
| 22-24 | 8,925 |
| 18-19 | 8,614 |
| 25-29 | 4,963 |
| 35 and over | 3,095 |
| 30-34 | 2,052 |
| Under 18 | 0 |
Footnotes
*The racial-ethnic minorities count is calculated by taking the total number of students and subtracting white students, international students, and students whose race/ethnicity was unknown. This number is then divided by the total number of students at the school to obtain the racial-ethnic minorities percentage.
References
Department of Homeland Security Citizenship and Immigration Services
Image Credit: By Michael Barera under License