UPenn total enrollment is approximately 26,552 students. 9,960 are undergraduates and 11,825 are graduate students.
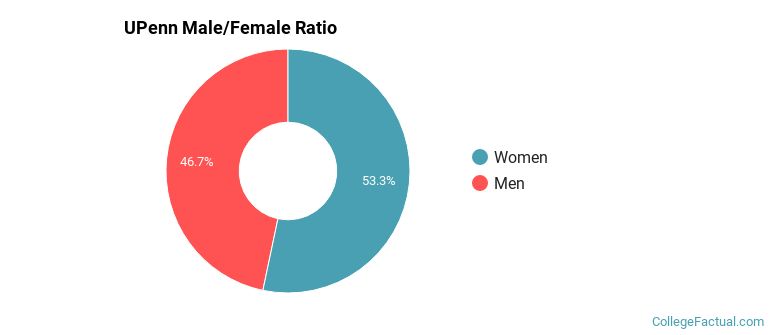
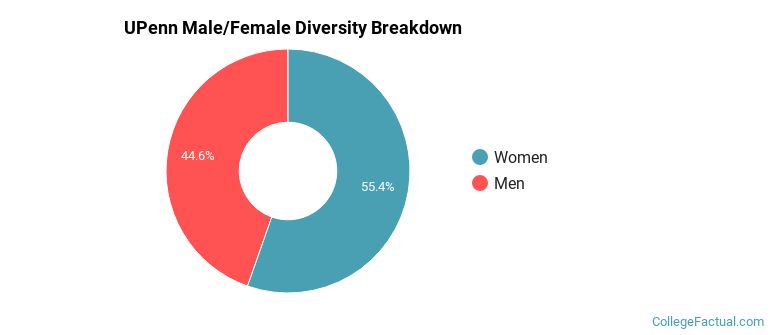
Male/Female Breakdown of Undergraduates
The full-time UPenn undergraduate population is made up of 54% women, and 46% men.
For the gender breakdown for all students, go here.
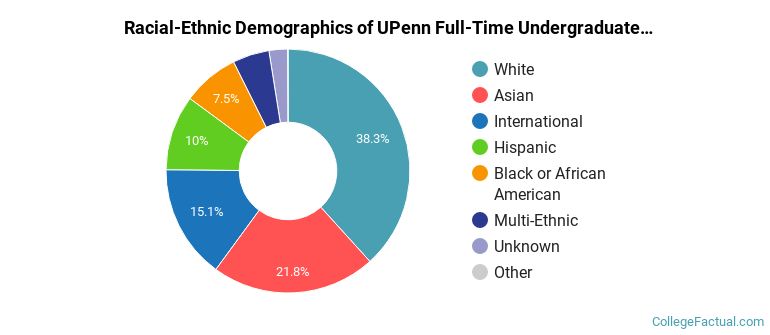
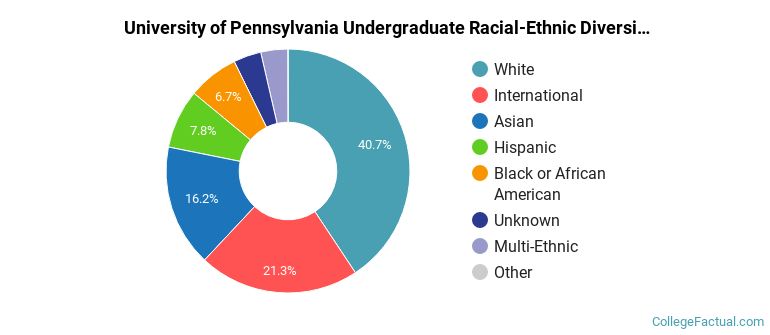
UPenn Racial/Ethnic Breakdown of Undergraduates
| Race/Ethnicity | Number |
|---|---|
| White | 3,618 |
| Asian | 2,438 |
| International | 1,288 |
| Hispanic | 1,028 |
| Black or African American | 758 |
| Multi-Ethnic | 489 |
| Unknown | 323 |
| Native Hawaiian or Pacific Islander | 6 |
See racial/ethnic breakdown for all students.
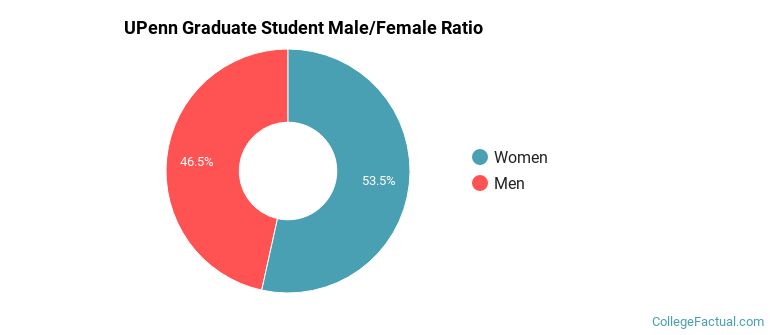
Male/Female Breakdown of Graduate Students
About 54% of full-time grad students are women, and 46% men.
For the gender breakdown for all students, go here.
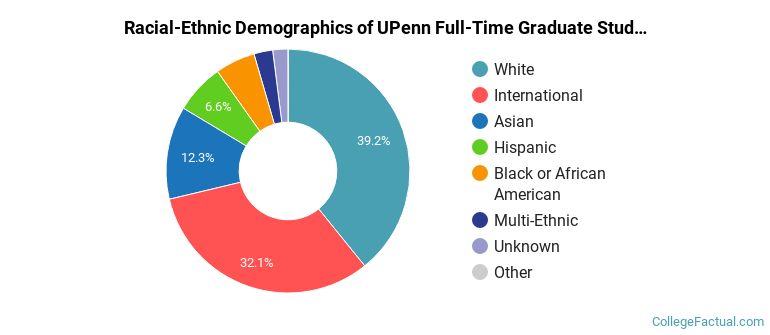
UPenn Racial-Ethnic Breakdown of Graduate Students
| Race/Ethnicity | Number |
|---|---|
| White | 4,713 |
| International | 3,404 |
| Asian | 1,632 |
| Hispanic | 715 |
| Black or African American | 682 |
| Multi-Ethnic | 394 |
| Unknown | 271 |
| Native Hawaiian or Pacific Islander | 2 |
See racial/ethnic breakdown for all students.
| Race/Ethnicity | Number |
|---|---|
| White | 10,691 |
| International | 5,183 |
| Asian | 4,877 |
| Hispanic | 2,009 |
| Black or African American | 1,808 |
| Multi-Ethnic | 1,076 |
| Unknown | 870 |
| Native Hawaiian or Pacific Islander | 9 |
There are approximately 14,719 female students and 11,833 male students at UPenn.
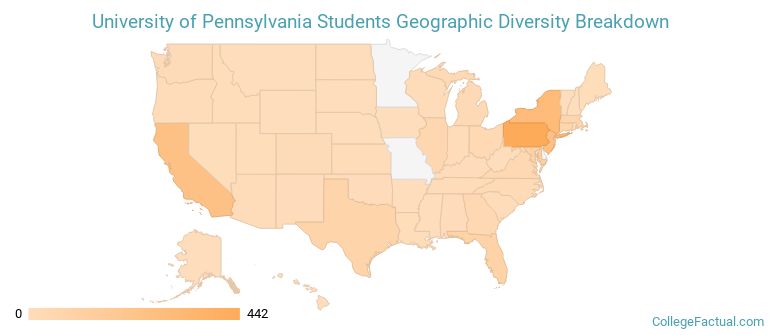
UPenn ranks 42 out of 2,183 when it comes to geographic diversity.
76.43% of UPenn students come from out of state, and 12.67% come from out of the country.
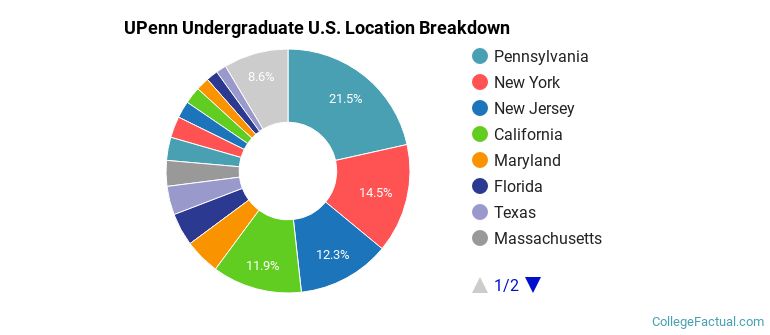
The undergraduate student body is split among 47 states (may include Washington D.C.). Click on the map for more detail.
| State | Amount |
|---|---|
| Pennsylvania | 442 |
| New York | 297 |
| New Jersey | 252 |
| California | 244 |
| Maryland | 97 |
Students from 138 countries are represented at this school, with the majority of the international students coming from China, India, and South Korea.
Learn more about international students at UPenn.
A traditional college student is defined as being between the ages of 18-21. At UPenn, 38.66% of students fall into that category, compared to the national average of 60%.
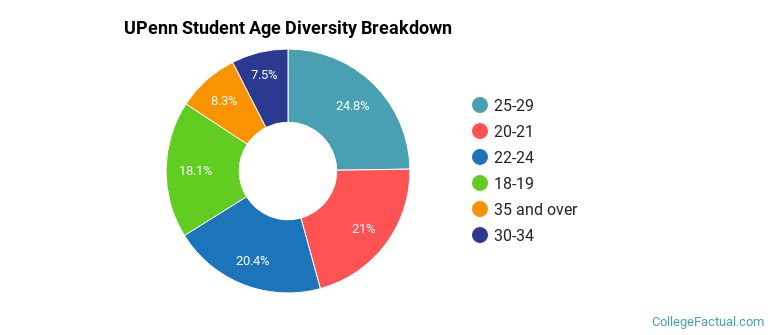
| Student Age Group | Amount |
|---|---|
| 25-29 | 6,210 |
| 20-21 | 5,261 |
| 22-24 | 5,116 |
| 18-19 | 4,546 |
| 35 and over | 2,070 |
| 30-34 | 1,883 |
| Under 18 | 0 |
Footnotes
*The racial-ethnic minorities count is calculated by taking the total number of students and subtracting white students, international students, and students whose race/ethnicity was unknown. This number is then divided by the total number of students at the school to obtain the racial-ethnic minorities percentage.
References
Department of Homeland Security Citizenship and Immigration Services
Image Credit: By WestCoastivieS under License