UOPX - Arizona total enrollment is approximately 89,763 students. 69,408 are undergraduates and 20,355 are graduate students.
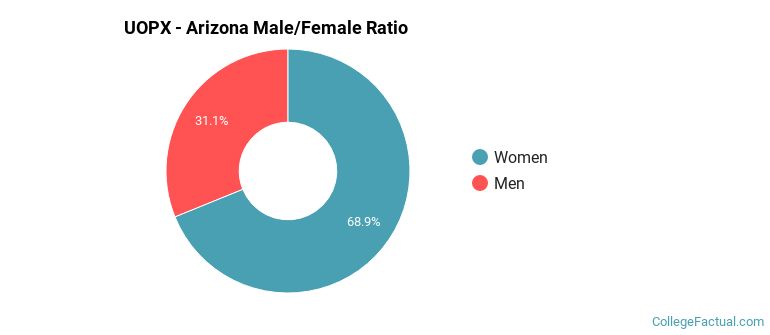
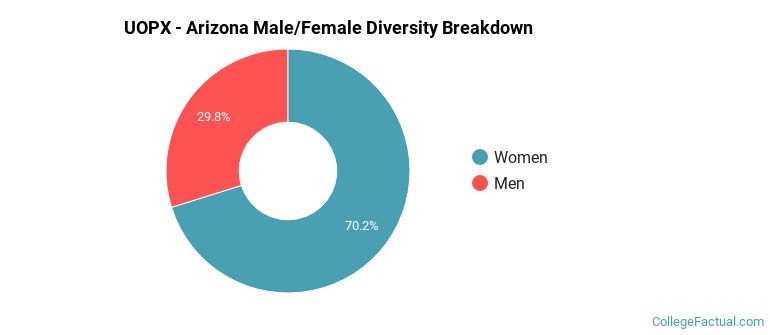
Male/Female Breakdown of Undergraduates
The full-time UOPX - Arizona undergraduate population is made up of 70% women, and 30% men.
For the gender breakdown for all students, go here.
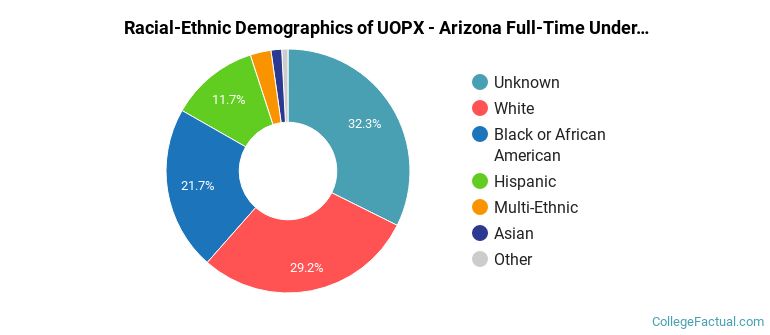
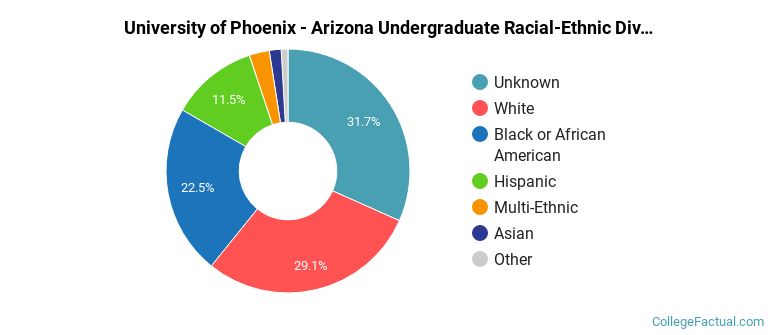
UOPX - Arizona Racial/Ethnic Breakdown of Undergraduates
| Race/Ethnicity | Number |
|---|---|
| Unknown | 27,919 |
| White | 17,437 |
| Black or African American | 13,194 |
| Hispanic | 7,335 |
| Multi-Ethnic | 1,672 |
| Asian | 844 |
| Native Hawaiian or Pacific Islander | 444 |
| International | 88 |
See racial/ethnic breakdown for all students.
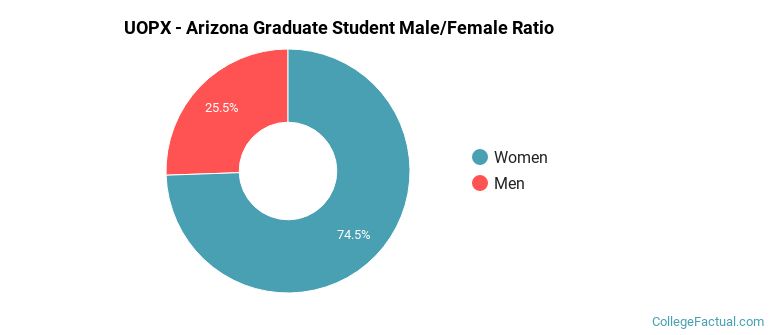
Male/Female Breakdown of Graduate Students
About 75% of full-time grad students are women, and 25% men.
For the gender breakdown for all students, go here.
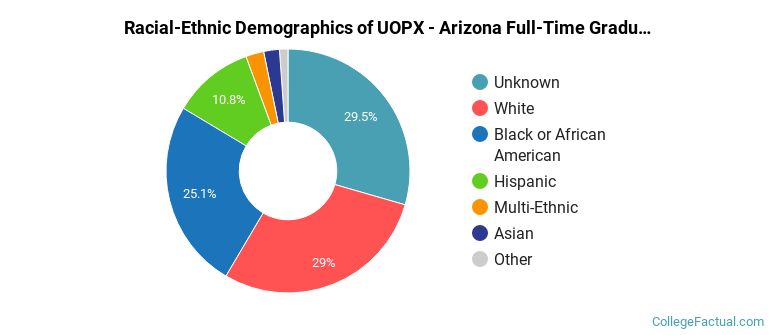
UOPX - Arizona Racial-Ethnic Breakdown of Graduate Students
| Race/Ethnicity | Number |
|---|---|
| Unknown | 6,968 |
| White | 5,104 |
| Black or African American | 5,014 |
| Hispanic | 2,055 |
| Multi-Ethnic | 449 |
| Asian | 391 |
| Native Hawaiian or Pacific Islander | 146 |
| International | 84 |
See racial/ethnic breakdown for all students.
| Race/Ethnicity | Number |
|---|---|
| Unknown | 34,887 |
| White | 22,541 |
| Black or African American | 18,208 |
| Hispanic | 9,390 |
| Multi-Ethnic | 2,121 |
| Asian | 1,235 |
| Native Hawaiian or Pacific Islander | 590 |
| International | 172 |
There are approximately 63,927 female students and 25,836 male students at UOPX - Arizona.
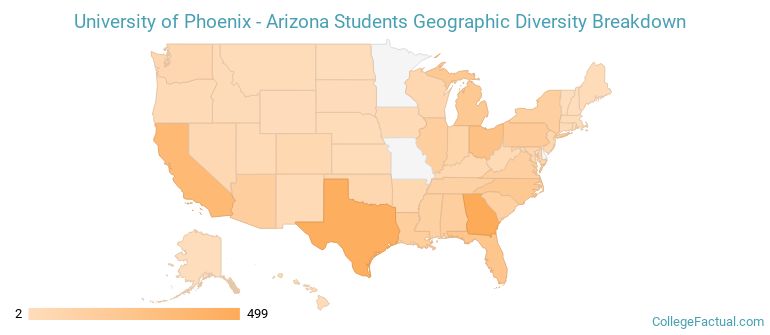
UOPX - Arizona ranks 8 out of 2,183 when it comes to geographic diversity.
96.9% of UOPX - Arizona students come from out of state, and 0.15% come from out of the country.
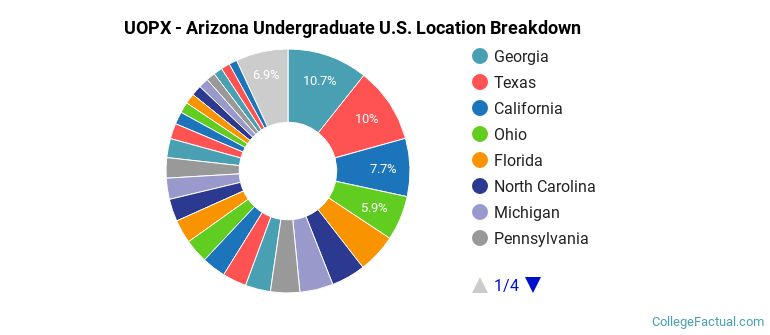
The undergraduate student body is split among 49 states (may include Washington D.C.). Click on the map for more detail.
| State | Amount |
|---|---|
| Georgia | 499 |
| Texas | 468 |
| California | 360 |
| Ohio | 277 |
| Florida | 242 |
Learn more about international students at UOPX - Arizona.
A traditional college student is defined as being between the ages of 18-21. At UOPX - Arizona, 3.60% of students fall into that category, compared to the national average of 60%.
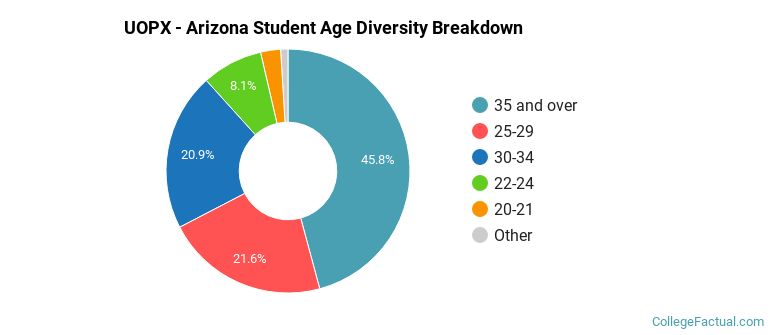
| Student Age Group | Amount |
|---|---|
| 35 and over | 47,410 |
| 25-29 | 22,325 |
| 30-34 | 21,666 |
| 22-24 | 8,348 |
| 20-21 | 2,742 |
| 18-19 | 1,006 |
| Under 18 | 0 |
Footnotes
*The racial-ethnic minorities count is calculated by taking the total number of students and subtracting white students, international students, and students whose race/ethnicity was unknown. This number is then divided by the total number of students at the school to obtain the racial-ethnic minorities percentage.
References
Department of Homeland Security Citizenship and Immigration Services
Learn more about how College Factual creates their Diversity Rankings.