Explore the best ranked schools for the programs you are most interested in.
College Factual ranked UOPX - California as #2,129 out of 2,152 colleges and universities in the country on its 2025 Best Colleges list. This is an improvement over the previous year, when UOPX - California held the #2,181 spot on the Best Overall Colleges list.
Out of the 161 colleges in California, UOPX - California is ranked at #158.
See all of the rankings for University of Phoenix - California.
At UOPX - California, the student to faculty ratio is an excellent 7 to 1. That's much better than the national average of 15 to 1. This indicates that many classes will probably be small, and students will have ample opportunites to work closely with their professors and classmates.
When estimating how much access students will have to their teachers, some people like to look at what percentage of faculty members are full time. This is because part-time teachers may not have as much time to spend on campus as their full-time counterparts.
The full-time faculty percentage at University of Phoenix - California is 6%. This is lower than the national average of 47%.
The on-time graduation rate is the percent of first-time, full time students who obtain their bachelor's degree in four years or less. This rate is 2% for first-time, full-time students at UOPX - California, which is lower than the national rate of 33.3%.
Find out more about the retention and graduation rates at University of Phoenix - California.
During the 2017-2018 academic year, there were 2,392 full-time undergraduates at UOPX - California.
See which majors at University of Phoenix - California make the most money.
Get more details about the location of University of Phoenix - California.
Contact details for UOPX - California are given below.
| Contact Details | |
|---|---|
| Address: | 3110 East Guasti Road, Ontario, CA 91761 |
| Phone: | 866-766-0766 |
| Website: | https://www.phoenix.edu/ |
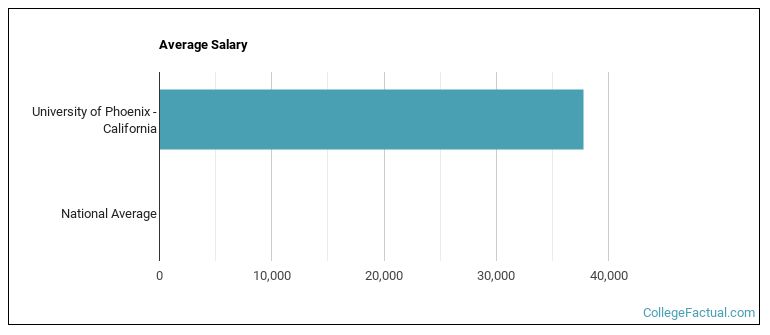
| Most Popular Majors | Bachelor’s Degrees | Average Salary of Graduates |
|---|---|---|
| Business Administration & Management | 503 | $58,268 |
| Nursing | 83 | $98,826 |
| Mental & Social Health Services | 72 | NA |
| Human Resource Management | 45 | $57,983 |
| Criminal Justice & Corrections | 43 | $47,987 |
| Computer Information Systems | 16 | $59,291 |
| Health & Medical Administrative Services | 16 | $44,580 |
| Accounting | 12 | $51,405 |
| Marketing | 11 | $63,570 |
| Human Services | 11 | $39,554 |
Online courses area a great option for busy, working students as well as for those who have scheduling conflicts and want to study on their own time. As time goes by, expect to see more and more online learning options become available.
In 2022-2023, 328 students took at least one online class at University of Phoenix - California. This is a decrease from the 532 students who took online classes the previous year.
| Year | Took at Least One Online Class | Took All Classes Online |
|---|---|---|
| 2022-2023 | 328 | 291 |
| 2021-2022 | 532 | 429 |
| 2020-2021 | 863 | 642 |
| 2018-2019 | 1,569 | 975 |
Learn more about online learning at University of Phoenix - California.
Footnotes
*The racial-ethnic minorities count is calculated by taking the total number of students and subtracting white students, international students, and students whose race/ethnicity was unknown. This number is then divided by the total number of students at the school to obtain the racial-ethnic minorities percentage.
References
More about our data sources and methodologies.