Pitt total enrollment is approximately 32,277 students. 18,298 are undergraduates and 7,045 are graduate students.
Male/Female Breakdown of Undergraduates
The full-time Pitt undergraduate population is made up of 54% women, and 46% men.
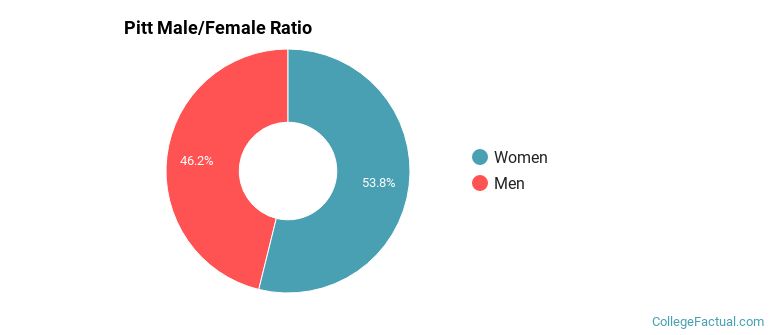
For the gender breakdown for all students, go here.
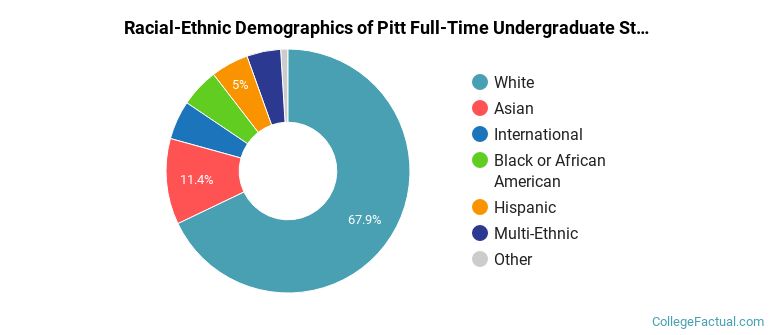
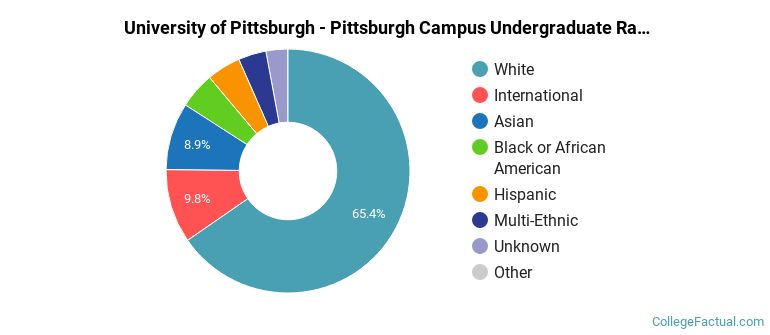
Pitt Racial/Ethnic Breakdown of Undergraduates
| Race/Ethnicity | Number |
|---|---|
| White | 12,170 |
| Asian | 2,240 |
| Hispanic | 1,056 |
| Black or African American | 961 |
| Multi-Ethnic | 860 |
| International | 829 |
| Unknown | 171 |
| Native Hawaiian or Pacific Islander | 4 |
See racial/ethnic breakdown for all students.
Male/Female Breakdown of Graduate Students
About 57% of full-time grad students are women, and 43% men.
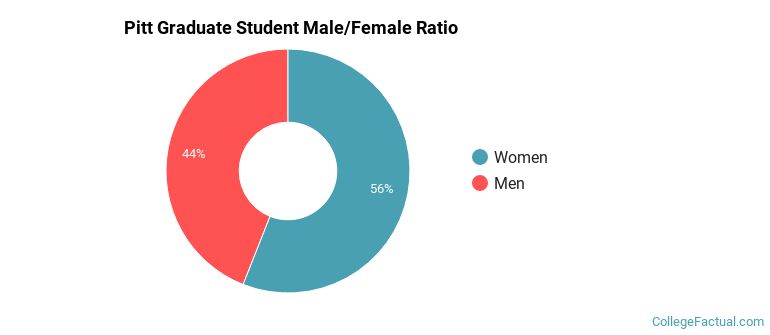
For the gender breakdown for all students, go here.
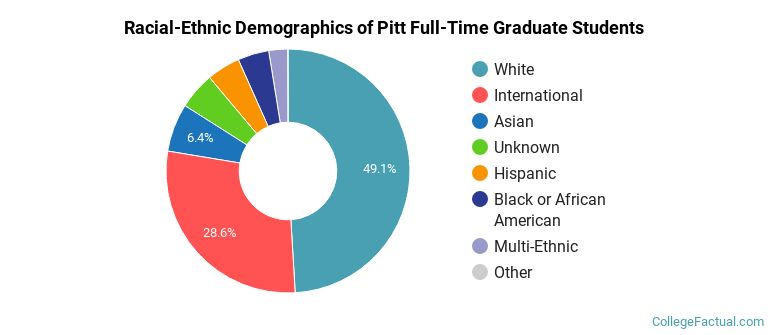
Pitt Racial-Ethnic Breakdown of Graduate Students
| Race/Ethnicity | Number |
|---|---|
| White | 3,603 |
| International | 1,720 |
| Asian | 528 |
| Hispanic | 347 |
| Unknown | 321 |
| Black or African American | 316 |
| Multi-Ethnic | 199 |
| Native Hawaiian or Pacific Islander | 5 |
See racial/ethnic breakdown for all students.
| Race/Ethnicity | Number |
|---|---|
| White | 20,981 |
| Asian | 3,177 |
| International | 2,696 |
| Hispanic | 1,675 |
| Black or African American | 1,602 |
| Multi-Ethnic | 1,268 |
| Unknown | 845 |
| Native Hawaiian or Pacific Islander | 12 |

There are approximately 18,095 female students and 14,182 male students at Pitt.
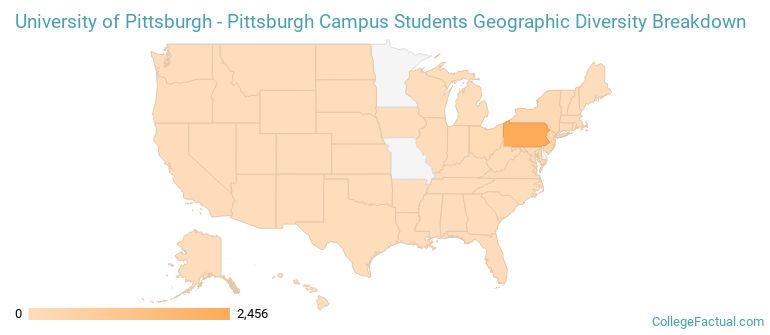
Pitt ranks 444 out of 2,183 when it comes to geographic diversity.
34.86% of Pitt students come from out of state, and 3.95% come from out of the country.
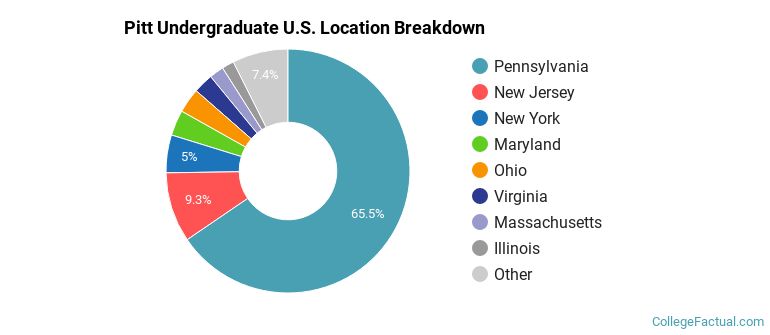
The undergraduate student body is split among 40 states (may include Washington D.C.). Click on the map for more detail.
| State | Amount |
|---|---|
| Pennsylvania | 2,456 |
| New Jersey | 348 |
| New York | 188 |
| Maryland | 127 |
| Ohio | 123 |
Students from 107 countries are represented at this school, with the majority of the international students coming from China, India, and Saudi Arabia.
Learn more about international students at Pitt.
A traditional college student is defined as being between the ages of 18-21. At Pitt, 55.68% of students fall into that category, compared to the national average of 60%.
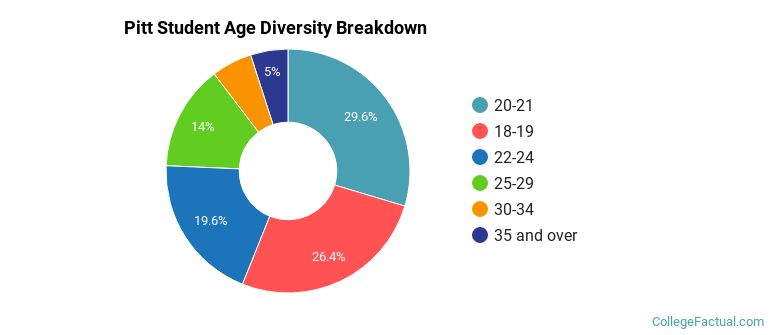
| Student Age Group | Amount |
|---|---|
| 20-21 | 8,430 |
| 18-19 | 7,517 |
| 22-24 | 5,575 |
| 25-29 | 3,968 |
| 30-34 | 1,533 |
| 35 and over | 1,412 |
| Under 18 | 0 |
Footnotes
*The racial-ethnic minorities count is calculated by taking the total number of students and subtracting white students, international students, and students whose race/ethnicity was unknown. This number is then divided by the total number of students at the school to obtain the racial-ethnic minorities percentage.
References