URichmond total enrollment is approximately 4,056 students. 3,137 are undergraduates and 467 are graduate students.
Male/Female Breakdown of Undergraduates
The full-time URichmond undergraduate population is made up of 53% women, and 47% men.

For the gender breakdown for all students, go here.
URichmond Racial/Ethnic Breakdown of Undergraduates

| Race/Ethnicity | Number |
|---|---|
| White | 1,891 |
| Hispanic | 341 |
| International | 240 |
| Asian | 216 |
| Black or African American | 193 |
| Multi-Ethnic | 147 |
| Unknown | 105 |
| Native Hawaiian or Pacific Islander | 1 |
See racial/ethnic breakdown for all students.
Male/Female Breakdown of Graduate Students
About 52% of full-time grad students are women, and 48% men.

For the gender breakdown for all students, go here.
URichmond Racial-Ethnic Breakdown of Graduate Students

| Race/Ethnicity | Number |
|---|---|
| White | 335 |
| Hispanic | 35 |
| Black or African American | 30 |
| Unknown | 21 |
| Asian | 19 |
| Multi-Ethnic | 14 |
| International | 13 |
| Native Hawaiian or Pacific Islander | 0 |
See racial/ethnic breakdown for all students.

| Race/Ethnicity | Number |
|---|---|
| White | 2,500 |
| Hispanic | 389 |
| Black or African American | 300 |
| International | 283 |
| Asian | 256 |
| Multi-Ethnic | 163 |
| Unknown | 159 |
| Native Hawaiian or Pacific Islander | 1 |

There are approximately 2,214 female students and 1,842 male students at URichmond.
URichmond ranks 106 out of 2,183 when it comes to geographic diversity.
81.97% of URichmond students come from out of state, and 10.28% come from out of the country.

The undergraduate student body is split among 39 states (may include Washington D.C.). Click on the map for more detail.
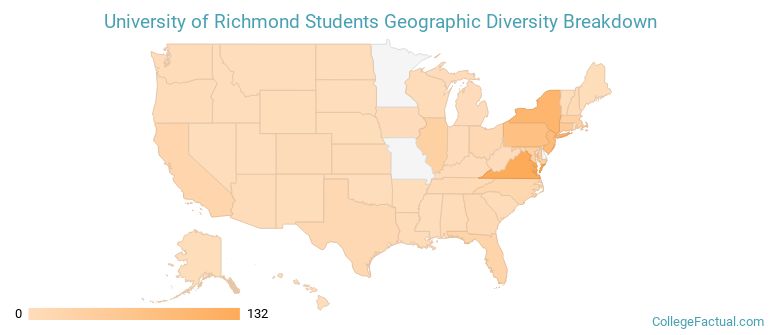
| State | Amount |
|---|---|
| Virginia | 132 |
| New York | 103 |
| New Jersey | 89 |
| Pennsylvania | 76 |
| Connecticut | 49 |
Students from 80 countries are represented at this school, with the majority of the international students coming from China, India, and Pakistan.
Learn more about international students at URichmond.
A traditional college student is defined as being between the ages of 18-21. At URichmond, 68.38% of students fall into that category, compared to the national average of 60%.
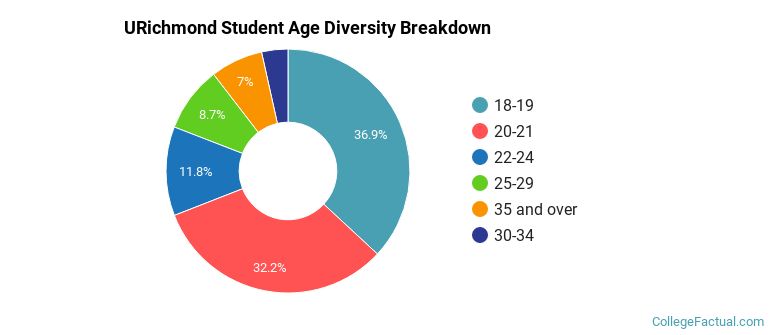
| Student Age Group | Amount |
|---|---|
| 18-19 | 1,470 |
| 20-21 | 1,281 |
| 22-24 | 470 |
| 25-29 | 346 |
| 35 and over | 277 |
| 30-34 | 139 |
| Under 18 | 0 |
Footnotes
*The racial-ethnic minorities count is calculated by taking the total number of students and subtracting white students, international students, and students whose race/ethnicity was unknown. This number is then divided by the total number of students at the school to obtain the racial-ethnic minorities percentage.
References
Department of Homeland Security Citizenship and Immigration Services
Image Credit: By Andrij Bulba under License