USD total enrollment is approximately 8,861 students. 5,294 are undergraduates and 1,728 are graduate students.
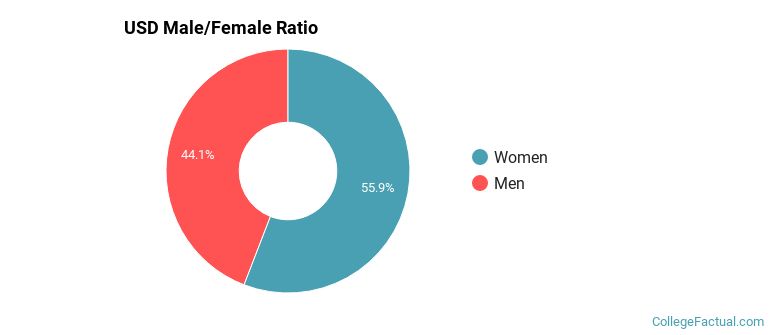
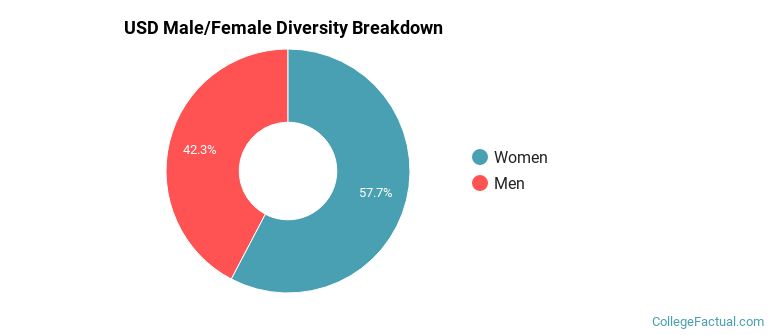
Male/Female Breakdown of Undergraduates
The full-time USD undergraduate population is made up of 58% women, and 42% men.
For the gender breakdown for all students, go here.
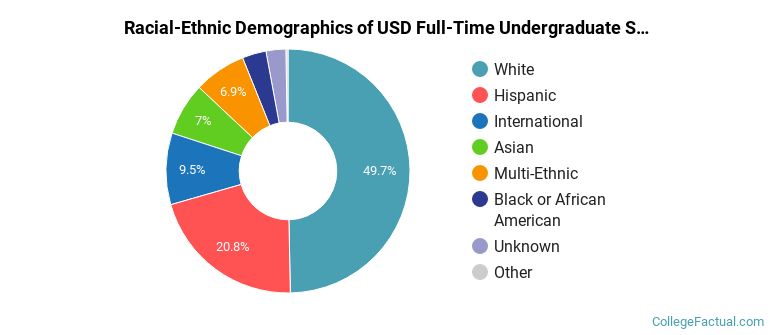
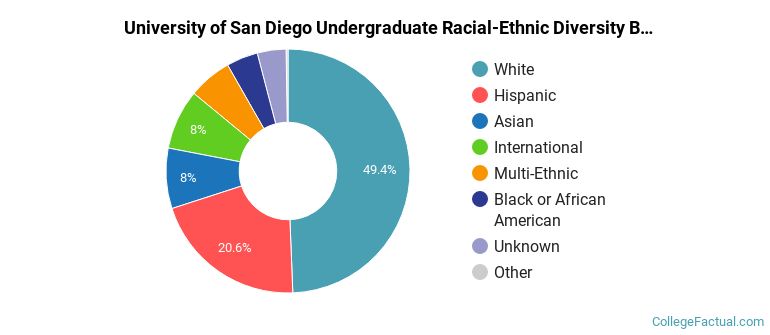
USD Racial/Ethnic Breakdown of Undergraduates
| Race/Ethnicity | Number |
|---|---|
| White | 2,604 |
| Hispanic | 1,172 |
| Asian | 394 |
| Multi-Ethnic | 391 |
| International | 378 |
| Black or African American | 164 |
| Unknown | 161 |
| Native Hawaiian or Pacific Islander | 13 |
See racial/ethnic breakdown for all students.
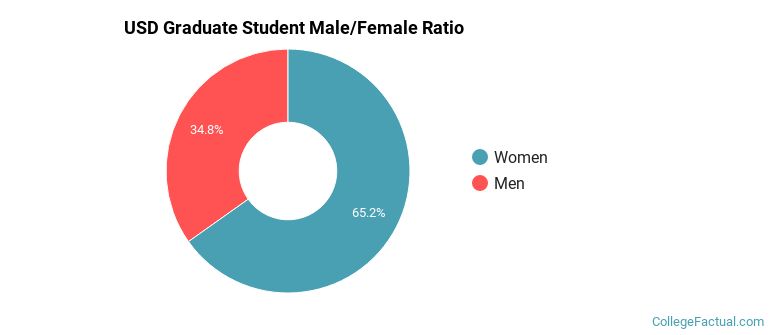
Male/Female Breakdown of Graduate Students
About 65% of full-time grad students are women, and 35% men.
For the gender breakdown for all students, go here.
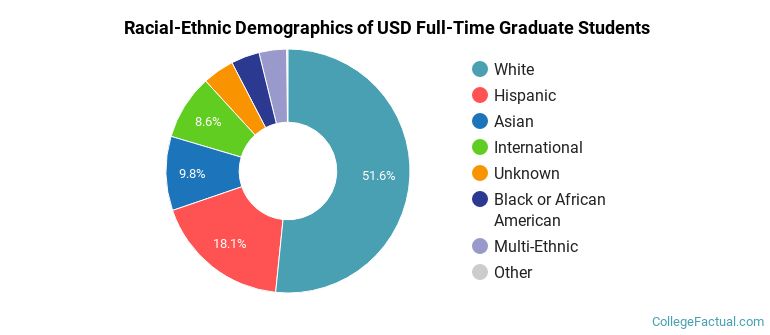
USD Racial-Ethnic Breakdown of Graduate Students
| Race/Ethnicity | Number |
|---|---|
| White | 903 |
| Hispanic | 356 |
| Asian | 160 |
| International | 82 |
| Black or African American | 74 |
| Multi-Ethnic | 74 |
| Unknown | 72 |
| Native Hawaiian or Pacific Islander | 2 |
See racial/ethnic breakdown for all students.
| Race/Ethnicity | Number |
|---|---|
| White | 4,318 |
| Hispanic | 1,961 |
| Asian | 744 |
| Multi-Ethnic | 552 |
| International | 501 |
| Black or African American | 374 |
| Unknown | 361 |
| Native Hawaiian or Pacific Islander | 23 |
There are approximately 5,141 female students and 3,720 male students at USD.
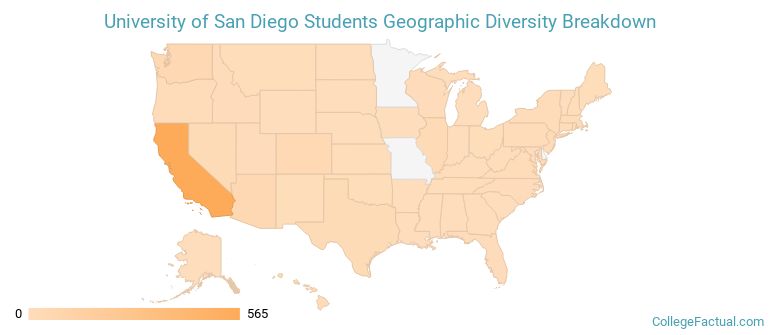
USD ranks 195 out of 2,183 when it comes to geographic diversity.
46.44% of USD students come from out of state, and 4.85% come from out of the country.
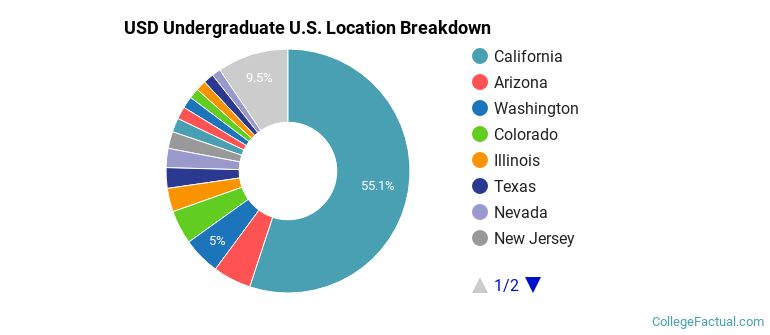
The undergraduate student body is split among 43 states (may include Washington D.C.). Click on the map for more detail.
| State | Amount |
|---|---|
| California | 565 |
| Arizona | 52 |
| Washington | 51 |
| Colorado | 46 |
| Illinois | 32 |
Students from 79 countries are represented at this school, with the majority of the international students coming from China, Kuwait, and Saudi Arabia.
Learn more about international students at USD.
A traditional college student is defined as being between the ages of 18-21. At USD, 52.41% of students fall into that category, compared to the national average of 60%.
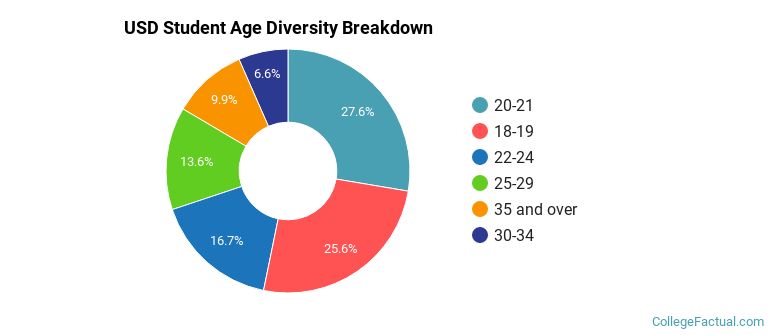
| Student Age Group | Amount |
|---|---|
| 20-21 | 2,424 |
| 18-19 | 2,243 |
| 22-24 | 1,461 |
| 25-29 | 1,194 |
| 35 and over | 871 |
| 30-34 | 577 |
| Under 18 | 0 |
Footnotes
*The racial-ethnic minorities count is calculated by taking the total number of students and subtracting white students, international students, and students whose race/ethnicity was unknown. This number is then divided by the total number of students at the school to obtain the racial-ethnic minorities percentage.
References