USFCA total enrollment is approximately 10,068 students. 5,572 are undergraduates and 1,869 are graduate students.
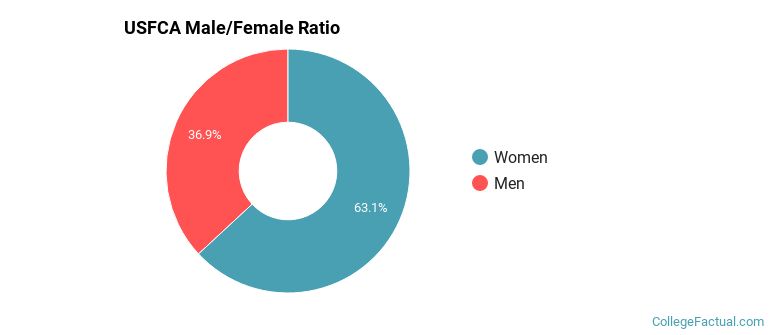
Male/Female Breakdown of Undergraduates
The full-time USFCA undergraduate population is made up of 64% women, and 36% men.
For the gender breakdown for all students, go here.
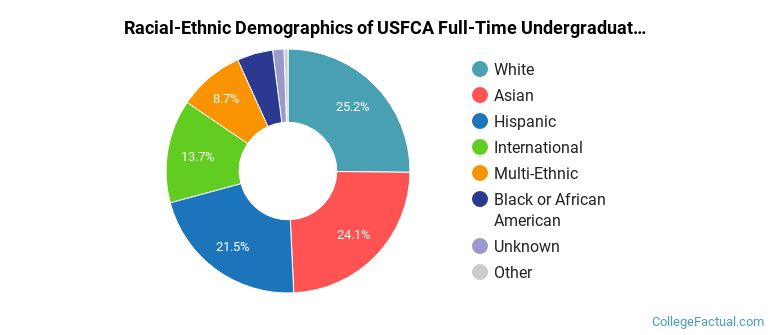
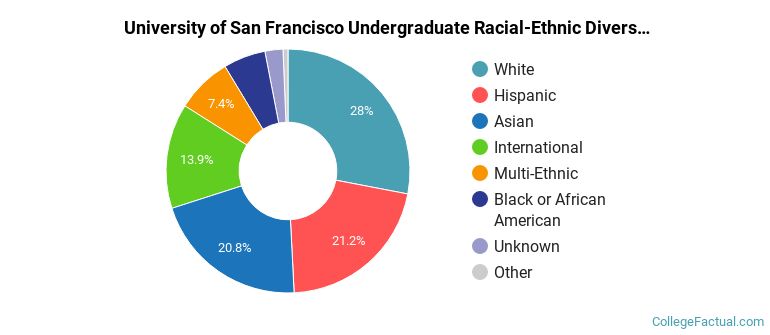
USFCA Racial/Ethnic Breakdown of Undergraduates
| Race/Ethnicity | Number |
|---|---|
| Asian | 1,479 |
| White | 1,308 |
| Hispanic | 1,153 |
| International | 662 |
| Multi-Ethnic | 547 |
| Black or African American | 331 |
| Unknown | 61 |
| Native Hawaiian or Pacific Islander | 24 |
See racial/ethnic breakdown for all students.
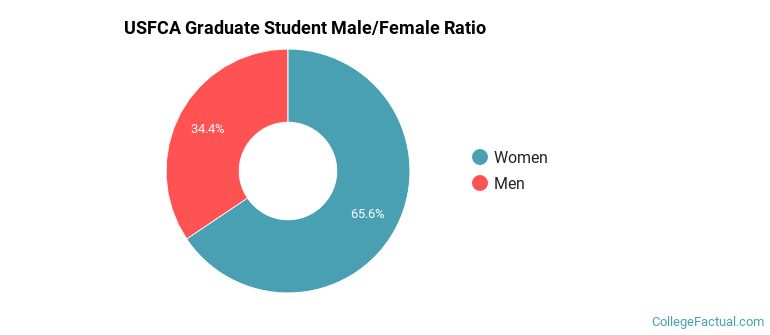
Male/Female Breakdown of Graduate Students
About 67% of full-time grad students are women, and 33% men.
For the gender breakdown for all students, go here.
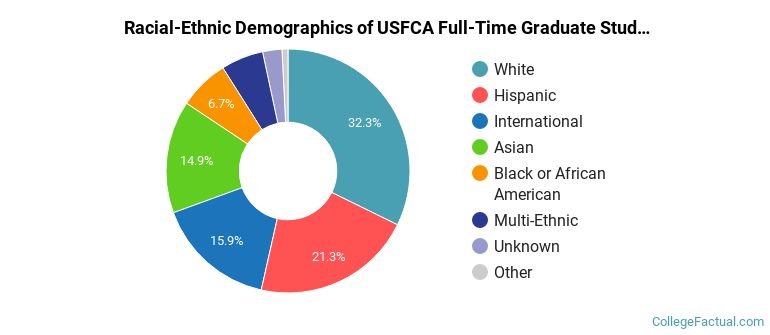
USFCA Racial-Ethnic Breakdown of Graduate Students
| Race/Ethnicity | Number |
|---|---|
| White | 583 |
| Hispanic | 425 |
| Asian | 296 |
| International | 292 |
| Black or African American | 133 |
| Multi-Ethnic | 99 |
| Unknown | 32 |
| Native Hawaiian or Pacific Islander | 8 |
See racial/ethnic breakdown for all students.
| Race/Ethnicity | Number |
|---|---|
| White | 2,738 |
| Asian | 2,222 |
| Hispanic | 2,114 |
| International | 1,277 |
| Multi-Ethnic | 800 |
| Black or African American | 642 |
| Unknown | 214 |
| Native Hawaiian or Pacific Islander | 47 |

There are approximately 6,483 female students and 3,585 male students at USFCA.
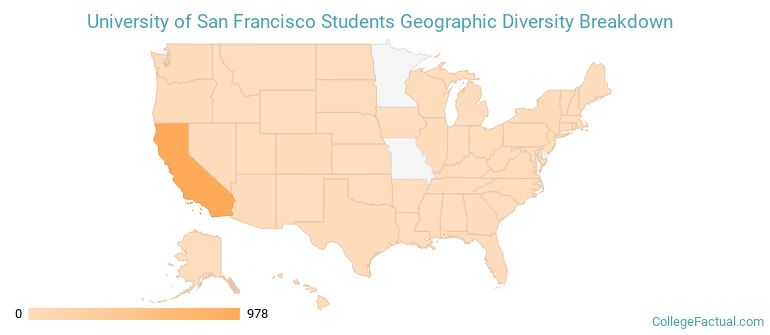
USFCA ranks 301 out of 2,183 when it comes to geographic diversity.
27.94% of USFCA students come from out of state, and 13.3% come from out of the country.
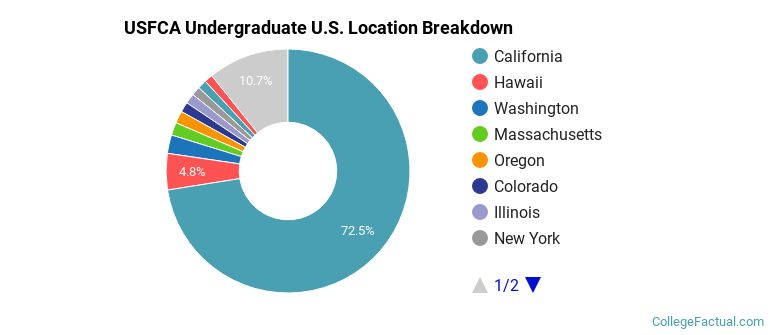
The undergraduate student body is split among 40 states (may include Washington D.C.). Click on the map for more detail.
| State | Amount |
|---|---|
| California | 978 |
| Hawaii | 65 |
| Washington | 33 |
| Massachusetts | 23 |
| Oregon | 22 |
Students from 100 countries are represented at this school, with the majority of the international students coming from China, India, and Indonesia.
Learn more about international students at USFCA.
A traditional college student is defined as being between the ages of 18-21. At USFCA, 48.30% of students fall into that category, compared to the national average of 60%.
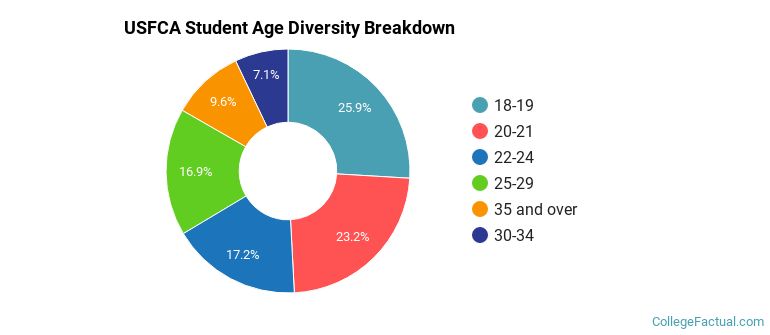
| Student Age Group | Amount |
|---|---|
| 18-19 | 2,819 |
| 20-21 | 2,524 |
| 22-24 | 1,874 |
| 25-29 | 1,833 |
| 35 and over | 1,048 |
| 30-34 | 768 |
| Under 18 | 0 |
Footnotes
*The racial-ethnic minorities count is calculated by taking the total number of students and subtracting white students, international students, and students whose race/ethnicity was unknown. This number is then divided by the total number of students at the school to obtain the racial-ethnic minorities percentage.
References