UofSC total enrollment is approximately 35,470 students. 26,174 are undergraduates and 5,630 are graduate students.
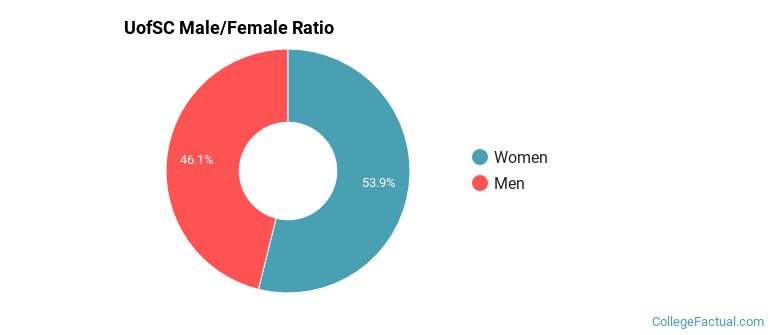
Male/Female Breakdown of Undergraduates
The full-time UofSC undergraduate population is made up of 54% women, and 46% men.
For the gender breakdown for all students, go here.
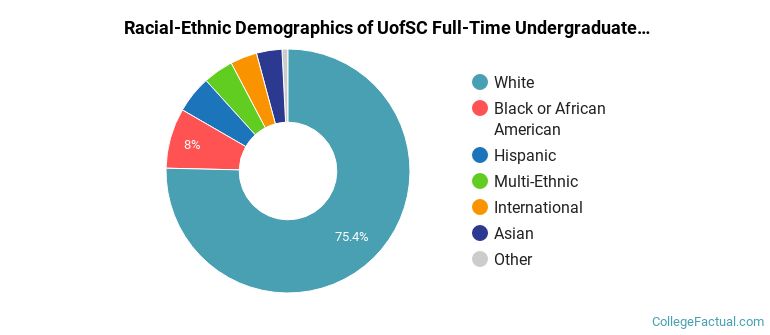
UofSC Racial/Ethnic Breakdown of Undergraduates
| Race/Ethnicity | Number |
|---|---|
| White | 19,559 |
| Black or African American | 2,223 |
| Hispanic | 1,380 |
| Multi-Ethnic | 1,091 |
| Asian | 989 |
| International | 656 |
| Unknown | 211 |
| Native Hawaiian or Pacific Islander | 22 |
See racial/ethnic breakdown for all students.
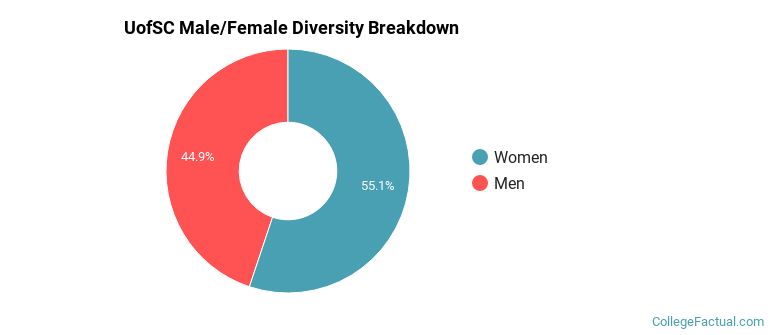
Male/Female Breakdown of Graduate Students
About 57% of full-time grad students are women, and 43% men.

For the gender breakdown for all students, go here.
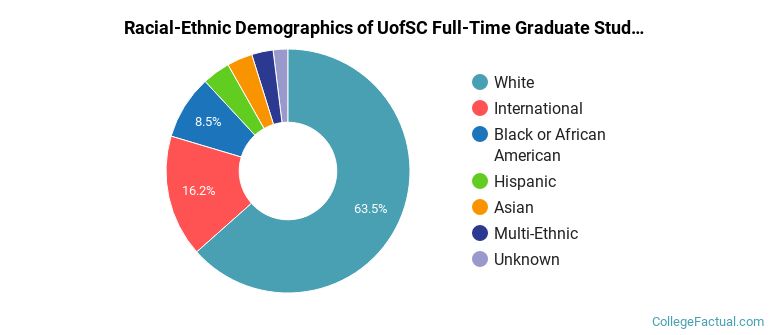
UofSC Racial-Ethnic Breakdown of Graduate Students
| Race/Ethnicity | Number |
|---|---|
| White | 3,538 |
| International | 832 |
| Black or African American | 518 |
| Hispanic | 213 |
| Asian | 203 |
| Multi-Ethnic | 177 |
| Unknown | 137 |
| Native Hawaiian or Pacific Islander | 0 |
See racial/ethnic breakdown for all students.

| Race/Ethnicity | Number |
|---|---|
| White | 25,560 |
| Black or African American | 3,389 |
| Hispanic | 1,742 |
| International | 1,620 |
| Multi-Ethnic | 1,380 |
| Asian | 1,279 |
| Unknown | 406 |
| Native Hawaiian or Pacific Islander | 26 |
There are approximately 19,703 female students and 15,767 male students at UofSC.
UofSC ranks 262 out of 2,183 when it comes to geographic diversity.
52.43% of UofSC students come from out of state, and 1.64% come from out of the country.

The undergraduate student body is split among 41 states (may include Washington D.C.). Click on the map for more detail.

| State | Amount |
|---|---|
| South Carolina | 2,391 |
| North Carolina | 487 |
| New Jersey | 270 |
| Virginia | 266 |
| Maryland | 249 |
Students from 108 countries are represented at this school, with the majority of the international students coming from China, India, and Saudi Arabia.
Learn more about international students at UofSC.
A traditional college student is defined as being between the ages of 18-21. At UofSC, 57.25% of students fall into that category, compared to the national average of 60%.

| Student Age Group | Amount |
|---|---|
| 20-21 | 11,221 |
| 18-19 | 8,661 |
| 22-24 | 7,282 |
| 25-29 | 3,599 |
| 35 and over | 2,270 |
| 30-34 | 1,569 |
| Under 18 | 0 |
Footnotes
*The racial-ethnic minorities count is calculated by taking the total number of students and subtracting white students, international students, and students whose race/ethnicity was unknown. This number is then divided by the total number of students at the school to obtain the racial-ethnic minorities percentage.
References
Department of Homeland Security Citizenship and Immigration Services
Read College Factual's Diversity Ranking Methodology.