Explore the best ranked schools for the programs you are most interested in.
USC Lancaster landed the #2,052 spot in College Factual's 2025 ranking of best overall colleges in the United States. The higher ed experts analyzed 2,152 colleges and universities across the nation to determine this ranking.
USC Lancaster also holds the #42 spot on the Best Colleges in South Carolina ranking.
See all of the rankings for University of South Carolina - Lancaster.
When it comes to admittance, University of South Carolina - Lancaster is somewhat selective. Its acceptance rate is 76%, which means you'll face some strong competition during the admissions process. Do what you can to make your application stand out.
With a student to faculty ratio of 16 to 1, University of South Carolina - Lancaster is about average in this regard as the nationwide rate is 15 to 1. While this does not translate directly to class size, it's a good indicator of how much time professors will have to spend with their students on a one-on-one basis.
When estimating how much access students will have to their teachers, some people like to look at what percentage of faculty members are full time. This is because part-time teachers may not have as much time to spend on campus as their full-time counterparts.
The full-time faculty percentage at University of South Carolina - Lancaster is 66%. This is higher than the national average of 47%.
The freshmen retention rate is a measure of what percentage of first-year, full-time students come back for their sophomore year. The 37% rate at University of South Carolina - Lancaster is a good bit lower than the national rate of 68%. This could be for a number of reasons, such as students transferring after a year because they changed majors.
During the 2017-2018 academic year, there were 1,810 undergraduates at USC Lancaster with 675 being full-time and 1,135 being part-time.
| $0-30 K | $30K-48K | $48-75 | $75-110K | $110K + |
|---|---|---|---|---|
| $5,930 | $7,693 | $10,460 | $12,986 | $13,469 |
The net price is calculated by adding tuition, room, board and other costs and subtracting financial aid.Note that the net price is typically less than the published for a school. For more information on the sticker price of USC Lancaster, see our tuition and fees and room and board pages.
While almost two-thirds of students nationwide take out loans to pay for college, the percentage may be quite different for the school you plan on attending. At USC Lancaster, approximately 39% of students took out student loans averaging $5,368 a year. That adds up to $21,472 over four years for those students.
Get more details about paying for University of South Carolina - Lancaster.
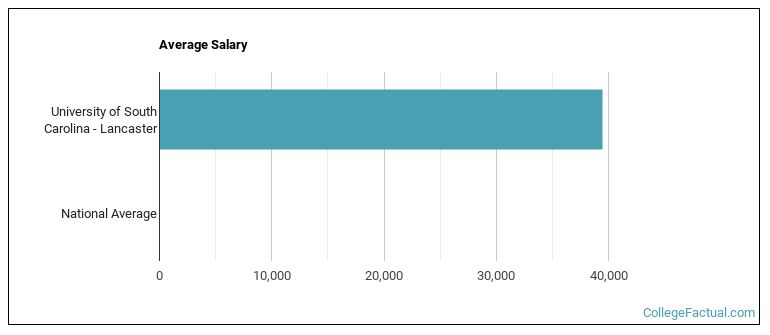
See which majors at University of South Carolina - Lancaster make the most money.
Get more details about the location of University of South Carolina - Lancaster.

Contact details for USC Lancaster are given below.
| Contact Details | |
|---|---|
| Address: | 476 Hubbard Drive, Lancaster, SC 29720-0889 |
| Phone: | 803-313-7000 |
| Website: | www.sc.edu/about/system_and_campuses/lancaster/index.php |
| Most Popular Majors | Bachelor’s Degrees | Average Salary of Graduates |
|---|---|---|
| Liberal Arts General Studies | 125 | NA |
| General Business/Commerce | 27 | NA |
| Nursing | 15 | NA |
| Criminal Justice & Corrections | 15 | NA |
Online courses area a great option for busy, working students as well as for those who have scheduling conflicts and want to study on their own time. As time goes by, expect to see more and more online learning options become available.
In 2022-2023, 1,075 students took at least one online class at University of South Carolina - Lancaster. This is an increase from the 974 students who took online classes the previous year.
| Year | Took at Least One Online Class | Took All Classes Online |
|---|---|---|
| 2022-2023 | 1,075 | 365 |
| 2021-2022 | 974 | 230 |
| 2020-2021 | 1,769 | 1,253 |
| 2018-2019 | 629 | 423 |
Learn more about online learning at University of South Carolina - Lancaster.
Footnotes
*The racial-ethnic minorities count is calculated by taking the total number of students and subtracting white students, international students, and students whose race/ethnicity was unknown. This number is then divided by the total number of students at the school to obtain the racial-ethnic minorities percentage.
References
More about our data sources and methodologies.