Here, you'll find out more about the major, including such details as the number of graduates, what degree levels are offered, ethnicity of students, average salaries, and more. Also, learn how USC ranks among other schools offering degrees in music.
Jump to any of the following sections:
Learn about start dates, transferring credits, availability of financial aid, and more by contacting the universities below.
Earn the music business degree that fits into the business world – and partners Southern New Hampshire University with world-renowned Berklee College of Music.
In College Factual's most recent rankings for the best schools for music majors, USC came in at #5. This puts it in the top 5% of the country in this field of study. It is also ranked #1 in California.
During the 2021-2022 academic year, University of Southern California handed out 78 bachelor's degrees in music. Last year, the same number of degrees were handed out.
In 2022, 70 students received their master’s degree in music from USC. This makes it the #14 most popular school for music master’s degree candidates in the country.
In addition, 20 students received their doctoral degrees in music in 2022, making the school the #20 most popular school in the United States for this category of students.
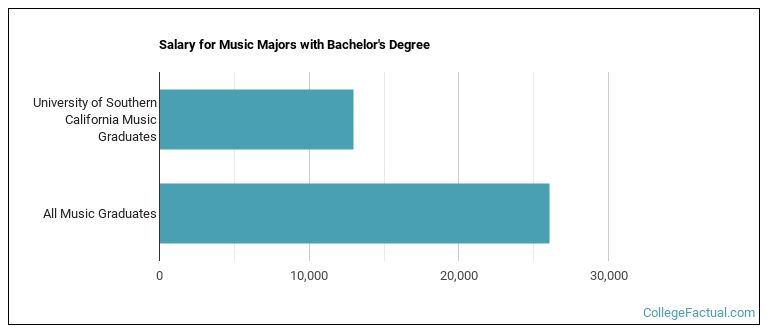
The median salary of music students who receive their bachelor's degree at USC is $12,947. This is less than $26,036, which is the national median of all music majors in the nation who earn bachelor's degrees.
The typical student loan payment of a bachelor's degree student from the music program at USC is $595 per month.
During the 2022-2023 academic year, part-time undergraduate students at USC paid an average of $2,244 per credit hour. No discount was available for in-state students. The following table shows the average full-time tuition and fees for undergraduates.
| In State | Out of State | |
|---|---|---|
| Tuition | $66,640 | $66,640 |
| Fees | $1,597 | $1,597 |
| Books and Supplies | $1,200 | $1,200 |
| On Campus Room and Board | $19,198 | $19,198 |
| On Campus Other Expenses | $1,818 | $1,818 |
Learn more about USC tuition and fees.
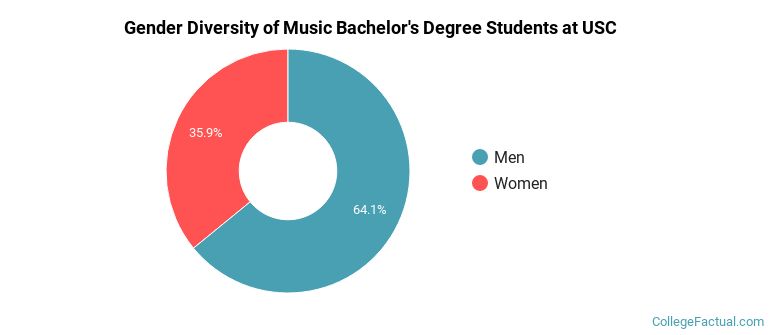
During the 2021-2022 academic year, 78 music majors earned their bachelor's degree from USC. Of these graduates, 64% were men and 36% were women.
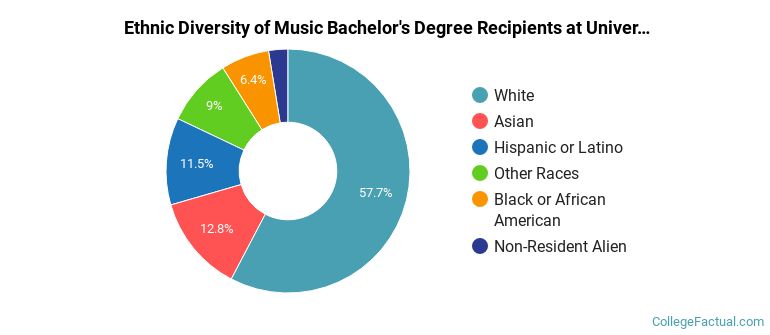
The majority of the students with this major are white. About 58% of 2022 graduates were in this category.
The following table and chart show the ethnic background for students who recently graduated from University of Southern California with a bachelor's in music.
| Ethnic Background | Number of Students |
|---|---|
| Asian | 10 |
| Black or African American | 5 |
| Hispanic or Latino | 9 |
| White | 45 |
| Non-Resident Aliens | 2 |
| Other Races | 7 |
USC does not offer an online option for its music bachelor’s degree program at this time. To see if the school offers distance learning options in other areas, visit the USC Online Learning page.
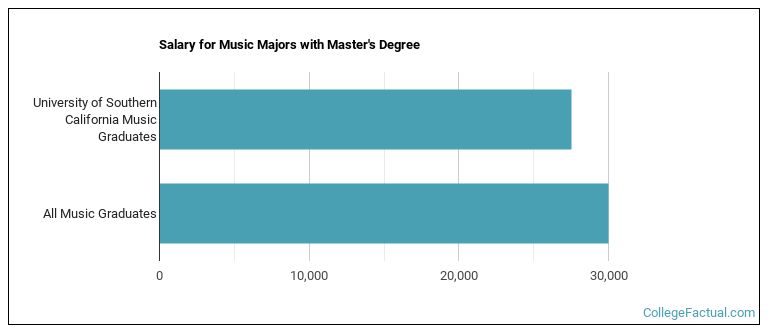
Graduates of the master's music program at USC make a median salary of $27,510. This is less than what their typical peers from other schools make. Their median salary is $29,974.
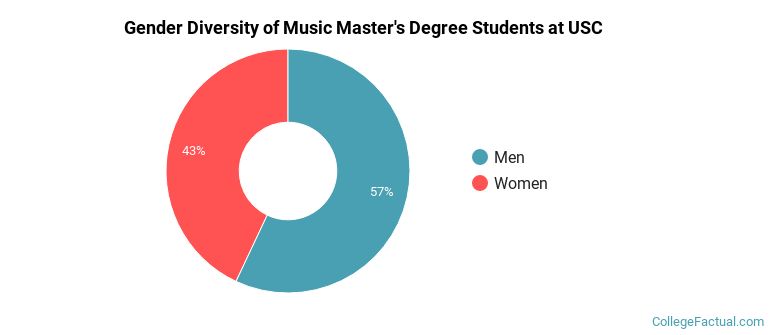
Of the 100 music students who graduated with a master's degree in 2021-2022 from USC, about 57% were men and 43% were women.
The following table and chart show the ethnic background for students who recently graduated from University of Southern California with a master's in music.
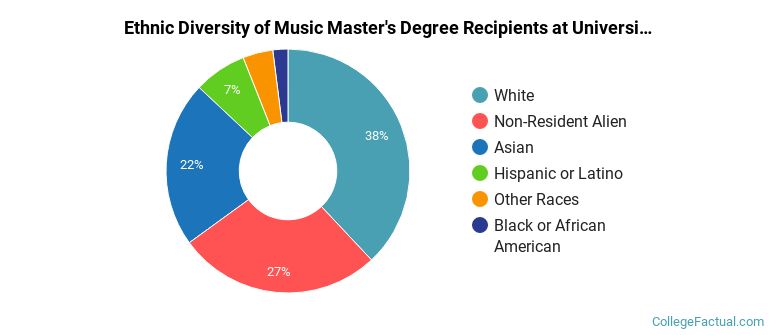
| Ethnic Background | Number of Students |
|---|---|
| Asian | 22 |
| Black or African American | 2 |
| Hispanic or Latino | 7 |
| White | 38 |
| Non-Resident Aliens | 27 |
| Other Races | 4 |
Take a look at the following statistics related to the make-up of the music majors at University of Southern California.
| Related Major | Annual Graduates |
|---|---|
| Film, Video & Photographic Arts | 317 |
| Drama & Theater Arts | 175 |
| Arts & Media Management | 114 |
| Fine & Studio Arts | 90 |
| Design & Applied Arts | 84 |
More about our data sources and methodologies.
